


In crypto trading, it's often said that volume precedes price. The Cumulative Volume Delta (CVD) indicator takes this a step further by distinguishing between buying and selling pressure. Instead of merely displaying total volume, CVD maintains a running total of the net difference between trades executed at the ask price (buys) and the bid price (sells). This “order flow” perspective can reveal whether bulls or bears are truly driving the market. In essence, CVD acts as a sentiment gauge, indicating whether market participants are collectively accumulating (buying) or distributing (selling) a cryptocurrency. By tracking these flows, traders can gain early insights into potential trend continuity or reversal that simple price charts might overlook.
Introduction
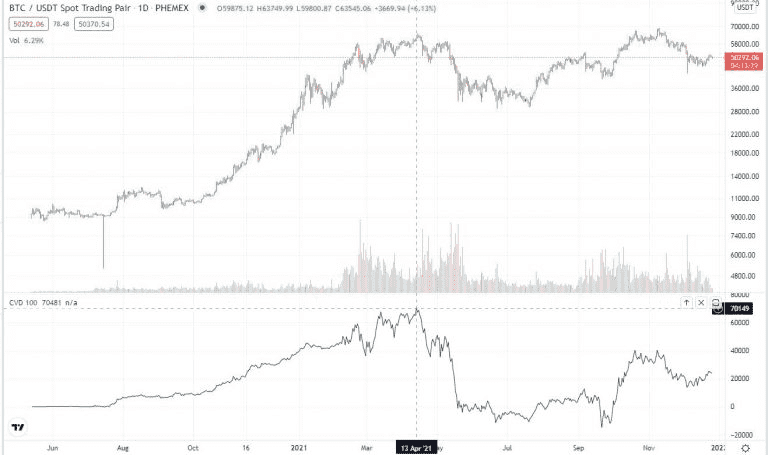
When Bitcoin’s price fluctuates, it ultimately reflects the balance of buying and selling activity. The CVD measures this imbalance. It begins each bar at zero and adds the volume of every buying trade while subtracting the volume of every selling trade. The resulting figure is plotted beneath the price: when CVD is rising, it indicates that net buying pressure is dominant, suggesting that prices may continue to rise. Conversely, if CVD is falling, it signifies that net selling pressure is prevailing, potentially signaling a price drop.
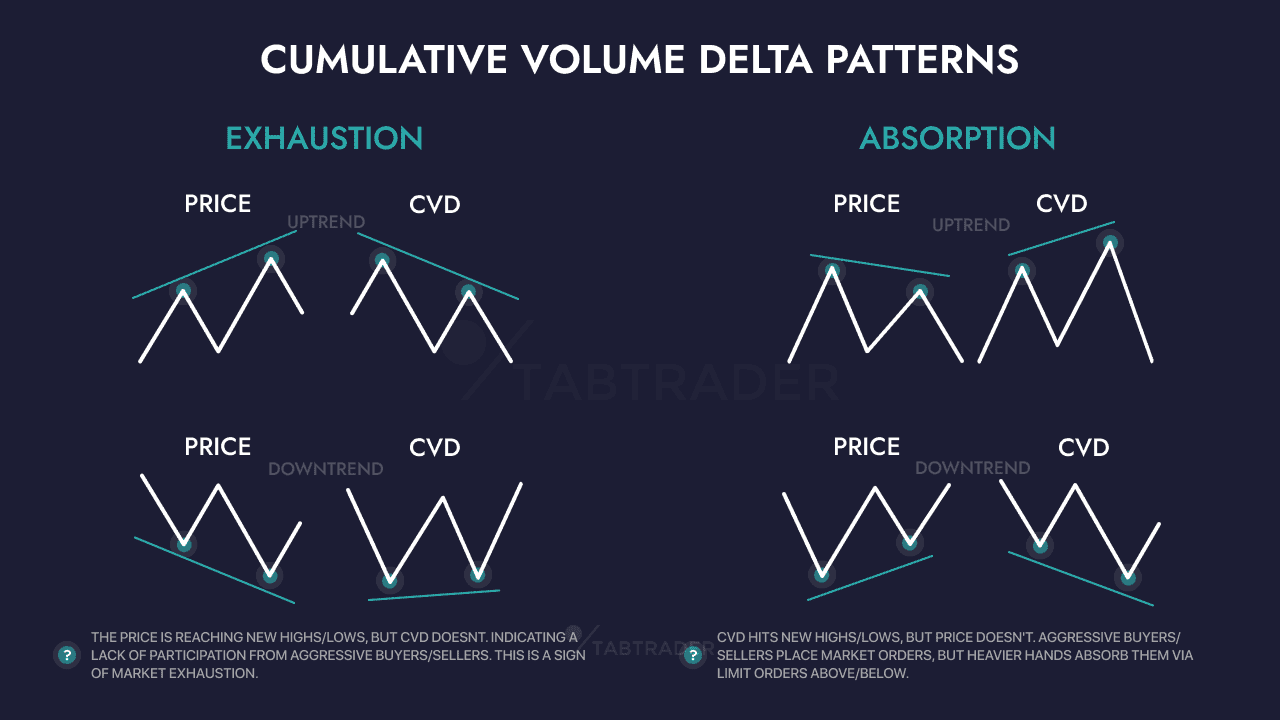
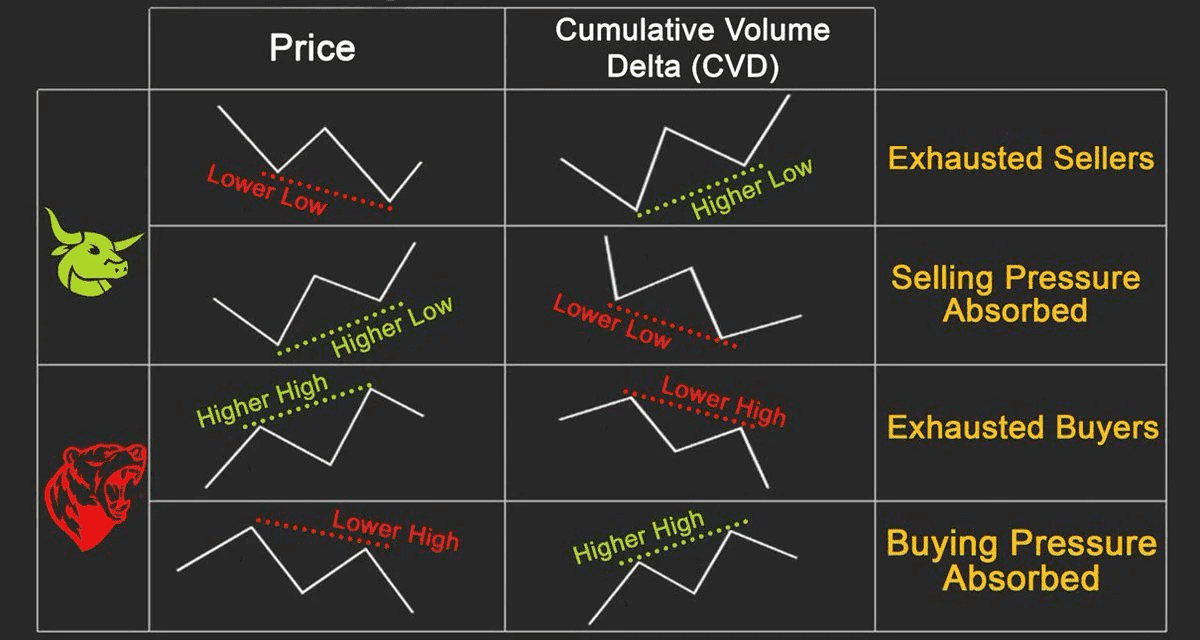
Traders utilize CVD to confirm price movements or identify divergences. For instance, if Bitcoin reaches a new high while CVD does not rise (instead leveling off or declining), this bearish divergence can signal underlying weakness. On the other hand, if the price hits a low but CVD remains flat or increases (bullish divergence), it may indicate hidden demand. In the volatile crypto markets, these volume clues can be invaluable for timing entries and exits.
What Is Cumulative Volume Delta (CVD)?
Cumulative Volume Delta (CVD) is essentially the accumulating total of "delta" volume—the difference between buying and selling volume—over a set period or across various price bars. It is also referred to as Market Delta. Unlike regular volume, which simply indicates total trades regardless of their direction, CVD reveals which side—buyers or sellers—has been more aggressive. For instance, if 100 coins are bought and 80 coins are sold within a bar, the delta is +20, indicating more buying activity. Over time, these deltas are added together, allowing CVD to rise into the hundreds of thousands if buying continues to dominate.
To illustrate how it works: in a minute of trading, if the volume of buys (trades at the ask price) exceeds that of sells, CVD increases by that difference. Conversely, if sells outnumber buys, CVD decreases. Therefore, a green upward-sloping CVD line indicates that buyers are consistently stronger, while a red downward slope signifies stronger selling pressure. Many trading platforms display CVD as either a line or a histogram beneath the price chart. It is essential not to confuse CVD with regular volume; CVD provides a more nuanced perspective by indicating whether the volume is mostly derived from buying or selling. This feature makes it particularly valuable among order flow and futures traders, and it is increasingly useful in the cryptocurrency market, where similar principles apply.
Psychology Behind the CVD Indicator
CVD reflects trader psychology and overall market sentiment. When CVD is steadily rising, it indicates sustained buying interest, potentially driven by optimism or the "fear of missing out." Traders recognize this trend and may feel more confident adding long positions, leading to a self-perpetuating cycle. On the contrary, a declining CVD suggests that sellers, or those taking profits, are more aggressive, which can signal fear or uncertainty in the market. Observing CVD also reveals subtle mood shifts: for example, if the price rises but CVD barely budges, it suggests that the upward movement lacks genuine buying conviction. According to Bookmap, positive CVD reflects aggressive buying (indicating upward momentum), while negative CVD indicates that sellers are dominating (indicating downward momentum).
In practice, a trader might express concerns like, “Even though Bitcoin is at resistance, I’m worried because CVD has stalled—sellers aren’t panicking and buying the dip like they did last time.”
Divergences between CVD and price can provide insights into hidden market psychology. If the price reaches a new high but CVD does not confirm this increase, it indicates that the high was achieved with minimal buying support, serving as a classic warning that bullish enthusiasm may be waning. Conversely, if the price drops to new lows but CVD does not decrease correspondingly, it suggests that sellers might be running out of steam, indicating a potential reversal. In summary, CVD offers emotional context that helps distinguish between genuine bullish momentum and a "fake" rally where sellers quietly take advantage of strength. Astute crypto traders use CVD divergences as early warnings to adjust their positions before price movements catch up.
How to Identify CVD on Charts
Cumulative Volume Delta (CVD) is often displayed as a single line or histogram beneath the price on many charting platforms. It might be labeled as “Cumulative Delta” or “Bid/Ask Volume.” Here’s how to read it:
-
Rising CVD: A green upward movement indicates net buying pressure. This aligns with upward price action. When CVD rises alongside price, it confirms strength in the market.
-
Falling CVD: A red downward slope signifies net selling pressure. If the price is falling while CVD is also declining, it confirms market weakness.
-
Zero Line: CVD typically starts at 0 at the beginning of the selected timeframe and then fluctuates. There is no fixed “overbought” value; instead, it’s the shape and slope of the CVD line that are important.
-
Charts and Timeframes: CVD can be analyzed on any timeframe—tick, minute, hourly, or daily. Shorter timeframes may present more noise, while longer timeframes tend to filter out this noise. For cryptocurrency, daily or 4-hour CVD charts often reveal meaningful trends, while 1-minute CVD can be quite volatile.
On the other hand, divergence signals occur when price and CVD move in opposite directions. For example, if the price rises but CVD remains flat or declines, it indicates a bearish divergence. Conversely, if the price drops while CVD is flat or rising, it suggests a bullish divergence.
How to Trade With CVD
Using Cumulative Volume Delta (CVD) in your trading strategy can enhance your timing:
-
Trend Confirmation: When Bitcoin is rising and CVD is also increasing significantly, it confirms the rally. In such a scenario, a trader might consider adding to long positions during price dips that are confirmed by CVD. If the price approaches resistance while CVD continues to rise, it may break through that level. Conversely, if the price increases but CVD's growth is weak, it's wise to exercise caution.
-
Entry Signals: One effective strategy is to enter trades on CVD breakouts. For instance, if Ethereum has been trading within a range and then CVD suddenly rises above previous highs, it indicates that buyers are entering the market—potentially signaling a good opportunity to buy the breakout. Similarly, if CVD drops sharply during a price breakdown, it supports the case for a short trade.
-
Divergence Trades: A common technique is to trade based on divergences. If Bitcoin reaches a new high but CVD fails to exceed its previous peak (indicative of a bearish divergence), a trader might tighten stop-loss orders or even consider initiating a short position, expecting a pullback. Conversely, if the price declines to a new low while CVD remains higher, it may be a signal to start looking for long entry opportunities. These divergence indications allow traders to act ahead of price movements based on volume sentiment.
-
Position Management: While holding a position, traders monitor CVD to confirm its strength. For example, if you are long and the price reaches new highs while CVD stalls or trends downward, it may be a warning that the current trend is losing momentum. In such cases, you might decide to take profits or move your stop-loss orders closer. If CVD continues to rise, it supports maintaining your position in the trend.
-
Algorithmic Strategies: Some quantitative traders have programmed bots to monitor CVD patterns. For instance, an algorithm might execute a buy order when CVD crosses above a moving average or trigger a sell order if CVD declines by a certain percentage. While this approach is more advanced, it demonstrates CVD's suitability for systematic trading in the cryptocurrency market.
A concrete example would be the following: Imagine BTC struggling against resistance, with sellers pushing CVD into negative territory, yet the price holds above support. Suddenly, CVD spikes upward (indicating buyers are entering), and the price breaks out. This "CVD spike confirming volume" provides added confidence to enter a long position. In summary, use CVD as a confirmation tool. Let volume pressure, whether positive or negative, validate what the price chart is indicating. When CVD aligns with your trade idea, it enhances the chances of success.
When Not to Use CVD (Limitations)
Cumulative Volume Delta (CVD) provides valuable insights but has its limitations.
First, the quality of data is crucial. CVD calculations rely on accurate labeling of buy and sell transactions in tick or exchange data. Some exchanges or aggregated feeds might have inaccuracies in tick direction, which can distort CVD. Additionally, during very low-volume periods, such as holidays, the CVD may produce noisy results that are difficult to interpret.
Second, in extremely rapid market movements, CVD may lag slightly behind price changes because it is a cumulative measure. It is not a leading indicator by itself. During events like flash crashes or spikes, a single large trade can skew the delta significantly, causing CVD to shift sharply in one direction, which may not be sustained.
Third, CVD is most effective in markets with good liquidity. In illiquid altcoins, swings in CVD can be erratic and less reliable. It tends to be more stable with major pairs, such as BTC or ETH.
Finally, no single analytical tool is infallible. CVD should be used to complement other analyses rather than replace them. For instance, if Bitcoin is in a strong uptrend and CVD is rising, this serves as confirmation. However, if CVD diverges from the trend, it acts as a warning signal—not a guarantee. Traders should always take into account the broader context, including fundamentals, news, and the overall trend.
Bonus Tips and Historical Notes
-
Relation to Volume Delta: Think of CVD as the integral of the Volume Delta indicator. While Volume Delta displays the immediate buy-sell imbalance for each bar, CVD provides a running total, which helps to smooth out minor fluctuations. This cumulative perspective makes it easier to identify significant buying and selling pressure over time.
-
Trading Ranges: In choppy trading ranges, CVD can be noisy. To address this, some traders look for volume exits from the range. For example, a sudden increase in CVD accompanied by a rise in overall volume can indicate that the range-bound trading is coming to an end.
-
Divergence Confirmation: If you notice a CVD divergence (for example, when prices rise while CVD remains flat), it’s best to pair that discovery with additional signals. Often, a bullish price pattern (such as a flag breakout) alongside a bearish CVD divergence may suggest waiting for a pullback before making a purchase.
-
Aligning Timeframes: Use higher timeframe CVD to determine the overall market bias. For instance, if the daily CVD chart for Bitcoin (BTC) indicates a strong upward trend, you can then look at the 1-hour CVD trends to find optimal entry points.
Cumulative Volume Delta provides insight into market orders, helping to translate price movements into clear buying or selling pressure. When used alongside price action and other indicators, CVD can give crypto traders an advantage in identifying both continuations and reversals.
Conclusion
CVD transforms volume data into actionable insights. By monitoring whether buyers or sellers dominate, traders can confirm trends and anticipate potential turning points. It's essential to observe how CVD behaves at critical support and resistance levels: divergences (such as when prices rise while CVD remains flat, or when prices fall while CVD stays flat) often indicate impending reversals. Additionally, volume-backed breakouts (where CVD spikes alongside price increases) are strong signals to follow the movement.
To apply this knowledge, open a chart on Phemex and overlay indicators. Use it to verify your analysis before entering a trade or to manage your current positions. Phemex’s advanced charting tools make it easy to visualize CVD alongside price action. While exploring the platform, also check out features like Earn programs or Pulse SocialFi, which can enhance your trading experience by leveraging community insights. As you navigate the fast-moving crypto markets in 2025 and beyond, incorporating CVD into your toolkit will allow you to stay attuned to the "heartbeat" of the market, enabling you to trade more wisely and with increased confidence.