


A cryptocurrency order book is a real-time list of buy and sell orders (bids and asks) on an exchange for a specific trading pair. It is a fundamental tool in trading, offering a window into market activity and liquidity. Before modern electronic trading, order books were physical ledgers updated by humans; today’s digital order books handle billions of updates per day automatically. Understanding how to read an order book can give traders insight into price levels of high demand or supply, potential support and resistance zones, and even the actions of large players (whales) in the market. In this article, we’ll explain what an order book is, how to interpret its data, the difference between order types, and strategies for using order book information to trade more effectively. We will also discuss advanced concepts like order book manipulation (spoofing) and new developments up to 2025, including visualization tools such as heatmaps and the use of order book data in conjunction with on-chain analytics.

What is an Order Book?
Essentially, an order book is a ledger of all open orders to buy or sell an asset on an exchange, organized by price level. For each price, it shows how many orders (and typically the total quantity) are waiting to be executed at that price. In an order book, you’ll find:
-
Bids (Buy Orders): These are orders from traders willing to buy, arranged from highest price to lowest. A bid includes a price and an amount (how much the trader wants to buy at that price). Bids represent demand and provide support to the price – they indicate that if the price dips, there are buyers ready at those levels.
-
Asks (Sell Orders): These are orders from traders willing to sell, arranged from lowest ask price to highest. Each ask has a price and amount to sell. Asks represent supply and create resistance – they show how much selling pressure exists at various price points above the current price.
The order book is typically divided into two halves – one listing bids (often colored green) and one listing asks (often colored red). The highest bid and lowest ask meet at the market price, also known as the top of the book. When a new order comes in that matches with an existing order (e.g., a buy matches the lowest ask), a trade executes and those orders are removed from the book.
Key fields you’ll see on an order book display usually include: Price, Size (Amount), and sometimes Total or Count of orders at that level. The Price is the specific rate for 1 unit of the asset. The Size is how many units are being bid or offered at that price. The Total could be cumulative volume up to that level, depending on the interface.
An order book gives a snapshot of market liquidity – how easily you can buy or sell without moving the price too much. If there are large amounts on the bid and ask side, the market is liquid and can absorb big orders; if amounts are thin, a single trade can move the price significantly (slippage).
Crypto Order Books vs. Traditional Markets
The concept of order books in crypto is the same as in stocks or FX, with a few distinctions:
-
Crypto trades 24/7 globally, so the order book is continuously updating around the clock. There is no opening or closing auction process like in stock markets; however, liquidity can vary by time of day.
-
Many crypto exchanges operate with multiple quote currencies (BTC, ETH, USDT, etc.), so each trading pair (e.g., BTC/USD, BTC/USDT) has its own separate order book. Arbitrage traders watch these to keep prices aligned, but sometimes differences can occur in depth (liquidity) between exchanges.
-
Decimal precision: Crypto prices can go to many decimal places and order book levels can be very granular (e.g., an order at $40000.12 for 0.5 BTC). Exchanges may limit the smallest price increment (tick size) or amount increment, but generally crypto order books handle a lot of precision.
-
In crypto, there is a phenomenon of many small orders (sometimes from bots) that can populate the book, whereas in stocks you often see round lots. This means crypto order books can have “clutter.” To address this, some traders aggregate levels (e.g., view how many BTC total are in bids from $39,000 to $39,100, rather than at every $1 increment).
Despite these nuances, the fundamental reading of an order book is similar. It’s one of the best sources of real-time data for analyzing market sentiment and trader intentions. For example, if you see a lot more volume on the bid side than the ask side, it might imply bullish pressure (buyers are eager and numerous at various levels, potentially pushing price up). If the ask side is stacked with large sell orders at and above current price, it could signal bearish sentiment or at least a near-term ceiling.
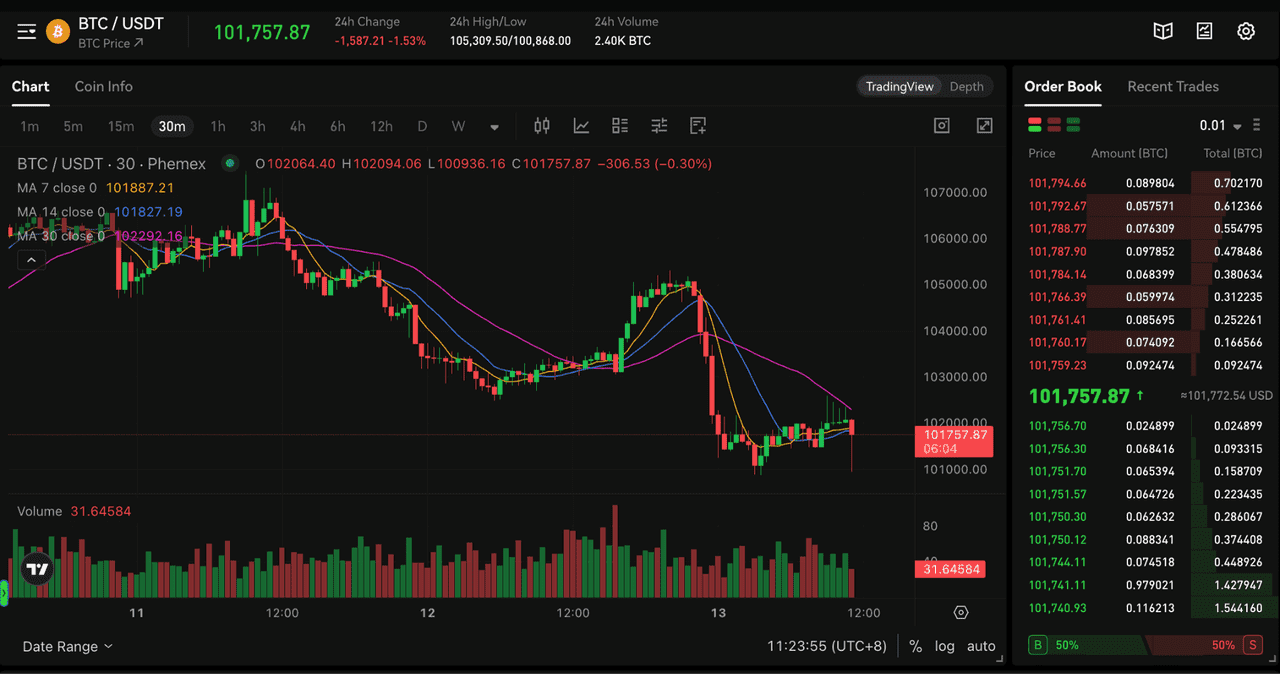
BTC/USDT Price Chart and Order Book on Phemex (source)
How to Read an Order Book
Reading an order book involves interpreting raw order data to extract key insights:
-
Key Price Levels: Look for significant orders, called walls. For instance, a 100 BTC bid at $40,000 amidst smaller bids suggests strong support, while a large sell wall above can denote resistance.
-
Spread: The bid-ask spread is the difference between the highest bid and lowest ask. A tight spread indicates good liquidity, while a wide spread can suggest low liquidity or high volatility, prompting traders to avoid those markets.
-
Order Book Depth: This reflects the volume of orders at various price levels. Depth charts visually represent this, revealing where liquidity sits. However, large players may hide their intentions by dynamically altering orders.
-
Recent Trades (Tape): Watching recent trade executions alongside the order book is beneficial. A big sell order followed by trades hitting it indicates buyers absorbing that wall, a bullish sign. Conversely, a wall with no trades might scare buyers, signaling bearish sentiment.
In a dynamic market, active traders focus on:
-
Speed of Changes: Rapid order fluctuations may indicate high-frequency trading or market testing.
-
Consistent Levels: Large players may place repeating orders at specific price points to maintain support.
-
Volume at Price: Reviewing past volume can reveal future support/resistance levels, like significant trades at $41k indicating a potential pivot point.
Limit Orders vs. Market Orders
To understand order books, one must know about order types:
A Limit Order is placed at a specific price and waits for execution in the order book. For example, a limit buy at $39,500 for 1 BTC will remain on the bid side until fulfilled. Limit orders are visible in the order book.
A Market Order is executed immediately at the best available price and consumes existing orders rather than appearing in the order book. For instance, a market buy for 5 BTC matches against the lowest asks until filled, effectively "removing liquidity."
An exchange's Matching Engine pairs market orders with limit orders, executing trades when prices overlap. The order book typically showcases only limit orders, but you can infer market activity by observing sudden price movements.
Limit orders suit patient traders seeking specific entry/exit points, while market orders indicate urgency. Large market sell orders may suggest quick exits due to negative news, whereas a surge of market buys can signal strong demand.
For instance, if the order book shows bids at $40,000.5 for 2 BTC, $40,000 for 5 BTC, etc., and asks at $40,001 for 1.5 BTC, and so forth, a market buy for 10 BTC would fill those asks and push the last traded price upward.
As a trader, you can strategically place orders just below a sell wall or above a buy wall to anticipate price movements.
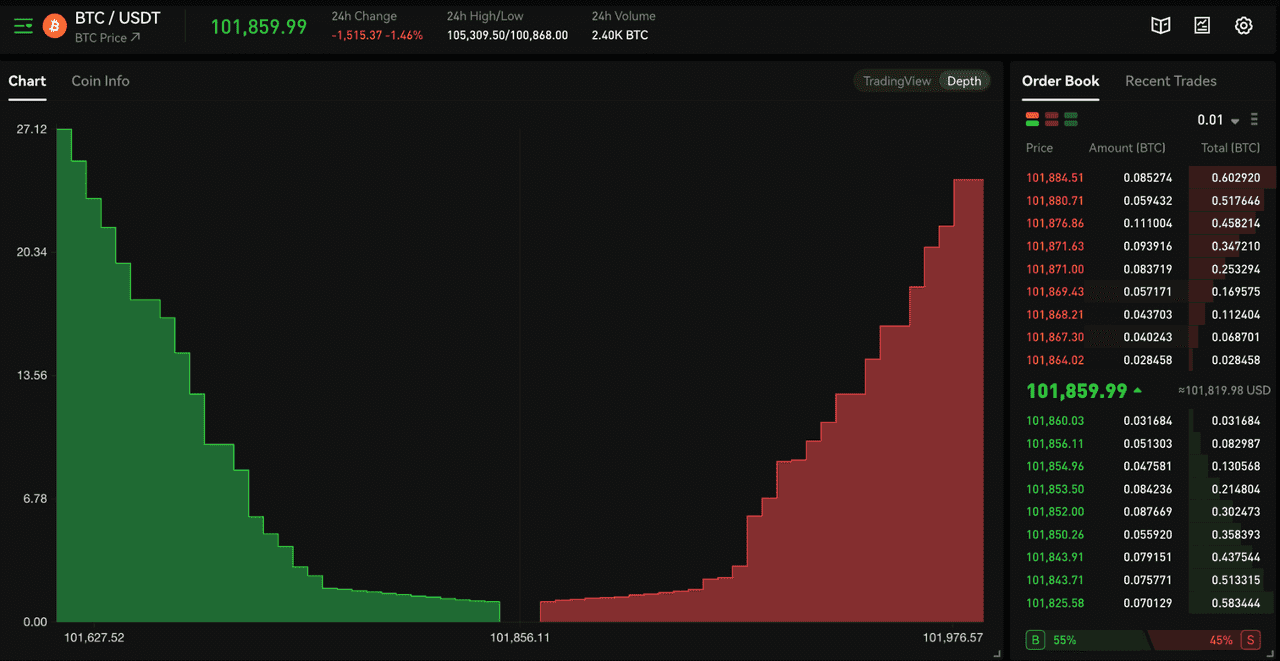
BTC/USDT Chart on Phemex (source)
Order Book Trading Strategy: Using Walls and Liquidity
A strategy involving order books focuses on trading around support and resistance walls.
A buy wall is a substantial cluster of buy orders that can halt price declines, leading to price bounces. Traders might buy slightly above a buy wall or set stop-loss orders below it. Conversely, a sell wall, a large cluster of sell orders at a certain level, can limit price increases. Traders might take profit just before a sell wall, while breaking it could lead to a sharp price rally.
Order book strategies often revolve around liquidity hunting, with large players utilizing walls to fill orders or manipulate the market. Markets tend to avoid heavily fortified prices until sufficient volume is present, leading to price oscillation between support and resistance walls. Traders can buy near support and sell near resistance, profiting from the range until conditions change.
Additionally, checking order book depth is crucial to mitigate slippage risk before executing large orders. Advanced techniques involve observing order book imbalances alongside technical patterns. For example, if sell walls diminish as price approaches a breakout point, it may signal a higher likelihood of a breakout. In contrast, the emergence of a large sell wall near a breakout point might indicate intent to suppress price movements.
Sophisticated traders may also analyze order book patterns to identify algorithmic trading behaviors, allowing them to adapt their strategies accordingly.
Special Consideration: Order Book Manipulation (Spoofing)
Order books can be manipulated, especially in less regulated markets or during low liquidity. A common tactic is spoofing, where a trader places a large order with no intention of executing it to mislead others. For instance, a spoofer might create an artificial buy wall to suggest strong support and then cancel it just as prices rise, or a sell wall to induce fear and then retract it after prices fall. While spoofing is illegal in many jurisdictions, it still occurs in crypto exchanges without strict oversight.
A notable example occurred in April 2025 when a massive 2,500 BTC sell order (~$212 million) on Binance was placed above the market price, causing temporary market stagnation. Once the order was pulled, volatility surged as the price dropped. This incident illustrated the need for traders to be cautious, as not all large orders are genuine. Signs of spoofing include orders that vanish as they approach or flash briefly before canceling.
Exchanges are improving their detection methods, and tools like heatmaps can visually display order book changes. In the Binance case, a heatmap clearly showed the $85,600 sell wall disappearing when the price reached it.
Besides spoofing, wash trading and coordinated orders can also create false market sentiment. If traders suspect manipulation, they should cross-reference order sizes across multiple exchanges for confirmation. In regulated markets, spoofing can result in hefty fines, but crypto regulations are still developing.
Practical advice for traders: Don’t rely solely on large orders when making decisions. Look for consistency in order behavior and consider using stop-losses to protect against sudden market shifts.
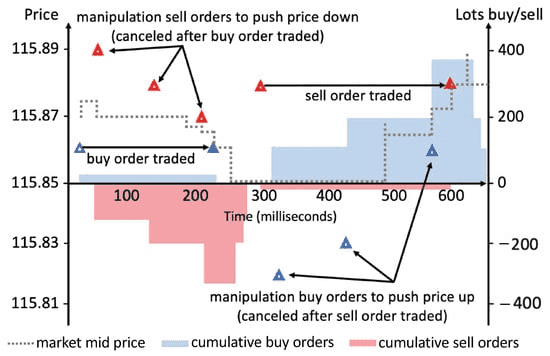
Order Book Manipulation (source)
Level 2 Data and Market Depth Visualization
The term “Level 2 data” usually refers to the full order book data – all the bids and asks and their quantities, not just the top of the book. Many exchanges offer an API that streams this data to advanced users or tools. For a human trader, staring at raw numbers scrolling can be overwhelming, especially for active markets. This is where visual tools like depth charts and order book heatmaps come into play.
-
Depth Chart: As described, it’s a snapshot graph of cumulative bids and asks. It’s good for quickly seeing the imbalance and approximate volume at various distances from price. However, it doesn’t show changes over time or order flow – it’s static at that moment.
-
Heatmap (Order Book Heatmap): This is a more sophisticated visualization showing price on one axis, time on another, and order volume as color intensity. For example, a horizontal bright band on the heatmap means there’s a large order sitting at that price over time. If the band suddenly breaks (goes away), you know the order was pulled or executed. Heatmaps basically allow you to see the evolution of the order book. They are immensely helpful to spot spoofing, as mentioned, and also to observe liquidity shifts – e.g., if the entire order book’s liquidity starts shifting upward (bands moving up), it could mean the market makers are adjusting to a bullish trend, etc. Some traders use heatmaps (via tools like Bookmap, Coinglass, Kiyotaka) to make real-time decisions that would be hard by reading numbers alone. For instance, you might see that every time price moves up, a big red band (sell order) appears a bit higher – that suggests someone is trying to continue capping the price. If you see that band get thinner (some of it getting filled, color intensity reducing) and then disappear, it might be time to jump in on the long side for a breakout.
Heatmaps in 2025 have become popular among day traders. Some exchanges even launch their own native depth visualization tools. These are especially useful in fast-moving markets or when news hits, to visually track where large orders are appearing.
Note that not all volume is shown in order books – some traders use hidden orders or trade on dark pools. Also, market orders (which don’t rest on the book) can sometimes dominate in events like a sudden dump or pump, which the order book won’t foretell except by absence of liquidity. An example: if an exchange has low liquidity at some price and a massive market sell comes in, the book might thin out in an instant as it’s being consumed, and you only see after the fact where the cascade stopped. So, order books are most useful in anticipating and observing gradual moves or ranges, but less so for catching a shock move (that’s more where stop-loss and circuit-breakers come in).
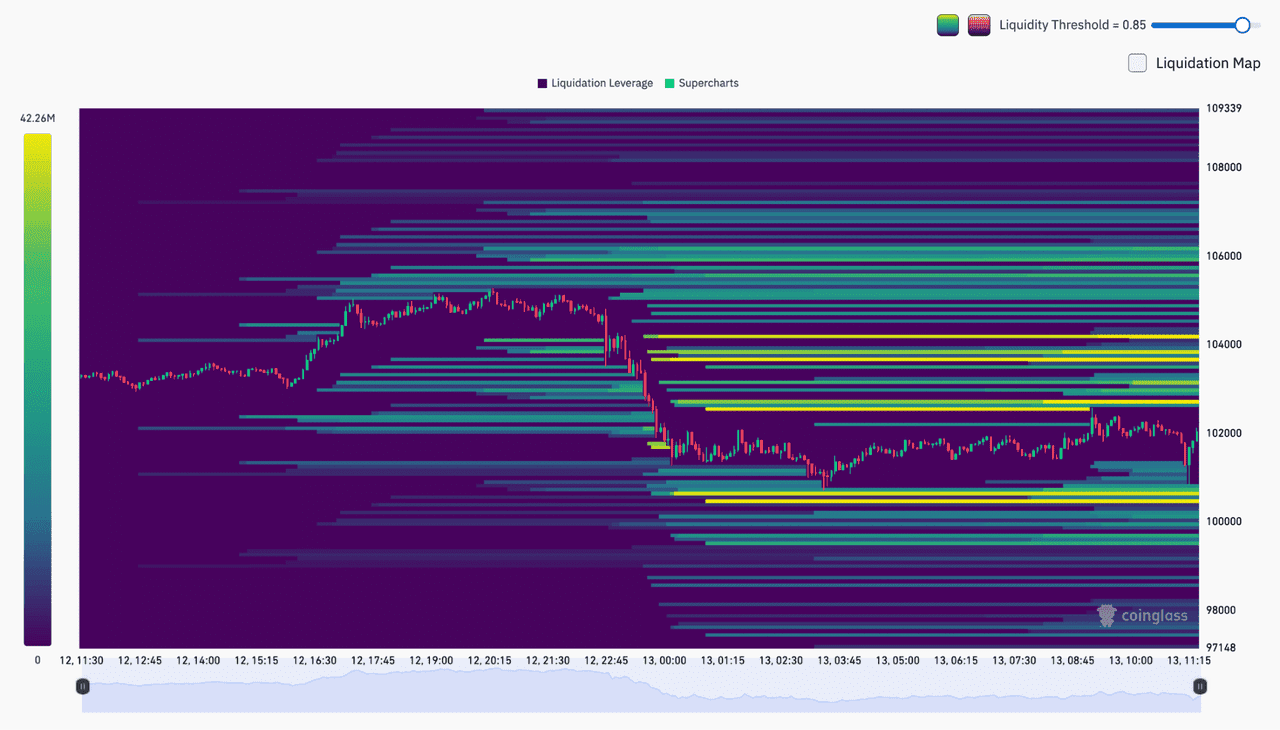
BTC Liquidation Heatmap (source)
Using Order Book Data with On-Chain Analysis
Crypto benefits from both off-chain data (exchange order books) and on-chain data (blockchain information about transfers and wallet activity), allowing for a comprehensive view of market dynamics.
Metrics like exchange inflow/outflow provide insights into Bitcoin movements. Large outflows (withdrawals) often indicate bullish accumulation, while significant inflows (deposits) may signal bearish sell pressure. Order book data further clarifies this: big inflows coupled with a sell wall suggest the BTC is intended for sale at a target price, while large outflows with decreasing sell-side liquidity indicate reduced selling interest.
Additionally, analyzing bid-ask spreads relative to an exchange's inventory can reveal liquidity changes. A decrease in BTC reserves alongside thinner sell-side depth reinforces a bullish supply squeeze. On the other hand, discrepancies between reported trade volume and on-chain transaction volume can signal wash trading.
Rising numbers of BTC addresses may suggest adoption, but if these coins aren't on exchanges, liquidity could be low—heightening market volatility. Before significant price moves, BTC often shifts onto exchanges to increase liquidity or is withdrawn to reduce supply, impacting price stability.
By 2025, analytics platforms have emerged that integrate both data types, offering clearer insights. For instance, a whale depositing 1000 BTC followed by a sell wall could indicate short-term bearishness. Utilizing multiple data sources helps mitigate reliance on potentially manipulated or incomplete order book information.
Conclusion
The order book is a vital tool for traders, offering insights into supply and demand at different price levels. By reading the depth, distinguishing between real and fake orders, and monitoring changes with market trades, traders can make informed decisions. For example, identifying a strong buy wall can reinforce a long position, while a sell wall might suggest it's time to take profits. However, it’s essential to remember that order book analysis isn't foolproof; large players can manipulate the market.
Combining order book observations with other analyses, like price trends, chart patterns, and on-chain indicators, provides a more comprehensive view. If technical analysis shows a breakout and the order book indicates reduced selling resistance, it could signal a strong trading opportunity.
New tools like heatmaps have made order book analysis more accessible to intermediate traders, helping them spot opportunities and avoid pitfalls in real-time. Many traders now track multiple exchange order books to identify arbitrage opportunities or see market trends.
In summary, mastering order book analysis can give you an edge, especially in short-term trading. However, it's just one aspect of the market, and large players and algorithms can influence what you see. Use appropriate risk management and practice reading order books in calm markets before trading during high volatility. With these skills, you can navigate the crypto landscape more confidently.