Traders and investors are always looking for ways to gain a solid entry into the market and are searching for those indicators that will give them the best chance to profit. To do this, they will analyze market trends and an asset’s price fluctuations, looking to see what assets are rising and why. However, when an asset is rising quickly, many will feel they have missed the boat. This is why when the asset’s value pulls back a little but seems to promise a continued upward trend, traders and investors alike will jump at the chance. This type of movement in the price chart of an asset is known as a pullback.

What Is a Market Pullback?
A pullback in trading is a momentary pause or dip in value of an asset’s overall trend. Pullbacks occur in two ways:
- Pullbacks in an uptrend: An asset is increasing in value and reaches a peak, it then pauses or dips down in value, and finally returns to its initial bullish trend.
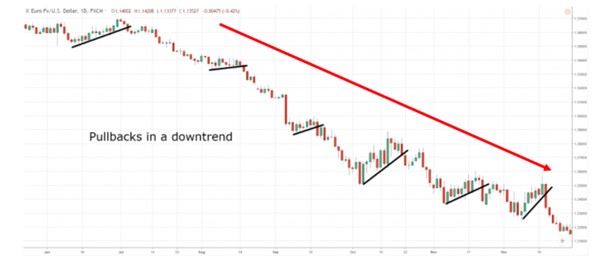
- Pullbacks in a downtrend: An asset is decreasing in value, it then pauses or dips upward in value, and finally returns to its initial bearish trend.


Market pullbacks in an uptrend and downtrend, respectively. (Source: www.tradingwithrayner.com)
Pullbacks in an upward trend often occur when an asset has been behaving bullishly and investors decide to lock in their profits, or when there has been a momentary loss in confidence in the asset. In scenarios such as these, many traders will choose to sell, which will make the asset’s value pause or decrease. However, so long as the asset is on a steady upward trend, then the asset will again begin to increase, which is when those buyers who bought in during the pullback will begin to see profitability. Thus, pullbacks are often seen as great buying opportunities.
Pullbacks work well because the buyer is buying into a period of value, thereby giving them a better risk-to-reward ratio, however, pullbacks are also risky business. Often, an asset’s increasing value may seem to go into a pullback but is in fact going into a reversal. If a trader buys in during what they think is a pullback, they may invest a considerable sum. If that pullback turns out to be a reversal, they will certainly have reason to be concerned.

The difference between a reversal and a pullback in market trends (Source: fxssi.com)
What Is the Difference Between a Reversal and a Pullback?
A pullback is a temporary reverse or pause in an asset’s overall value trend, meaning that it will only stop or decrease/increase in value for a short period of time before resuming its original behavior. A reversal, as indicated by its name, is a reversal of the trend — bullish into bearish, or bearish into bullish. Being able to identify which is which can mean the difference between great profitability and great loss. However, while easy to see these trends in a price graph after they have occurred, it can be exceedingly difficult to be sure at the time of action. This is why traders should do their research to ensure that they understand what it is that is driving the asset’s value up — is it a passing fad or has the company/platform/other behind the asset incorporated new changes or updates that will positively/negatively affect its value, regardless of passing trends? If the asset’s change in value is down to a passing trend, this is not necessarily negative either, but the trader must know how long that trend will last and accordingly know when to get out.
How Do You Use a Pullback to Enter the Market?
A pullback offers the best risk-to-reward just before it returns toward its original trend. The point of entering the market on a pullback is to trade in the direction of the underlying trend, but to enter at the lowest risk possible by marking where a pullback is coming. To do this, a trader must identify where to come in. There are many pullback trading strategies, with the most common being to use the Fibonacci retracement indicator to draw the Fibonacci ratios and to detect the resistance and support levels where the price may reverse. The key Fibonacci levels are 38.2%, 50%, and 61.8%, but the level depends on the strength of the trend and the extent of the pullback — with stronger trends having lower pullback levels.
Four steps to identify when to enter the market
A few key steps can be followed to identify when to enter into the trade and profit from the pullback:
- Identify a bullish trend in an asset’s value that is characterized by higher highs and higher lows, meaning that despite these fluctuations, the asset’s value is crashing upwards.
- Switch to viewing on a lower time frame, for example a 1-hour time frame, and identify the most recent higher high (peak) and higher low (pullback).
- Place the Fibonacci retracement indicator between the latest peak and its pullback.
- Buy/enter the market when the value reaches anywhere between the 50% and 61.8% Fibonacci retracement area. Deciding whether you can wait for the pullback to reach 61.8% is a personal choice which will become easier with practice.

Use of the Fibonacci retracement tool to identify where to enter the market when pullback trading. (Source: tradingstrategyguides.com)
It is important to note that some traders will choose to wait for a confirmation of the pullback coming back onto the trend — which is characterized by a candle reversing into the trending direction. This is a safer option in that it is less likely to turn into a reversal, however, the risk-to-reward ratio is much lower. In addition, a trader could easily wait for that confirmation only to see the value suddenly jump up or down (depending on the direction of the trend), thereby missing out on big profits.

Missing out on profitability by waiting for confirmation in pullback strategy trading. (Source: tradingwithrayner.com)
Why Are There Such Big Pullbacks in Crypto?
Crypto pullbacks are very normal and frequent, but one thing that stands out is how much more extreme they are than those seen in stocks and bonds, for example. The main reason for this is cryptocurrency’s volatility. It is still a new form of asset and one that is continuously evolving and growing — as has been seen by crypto’s entrance into national currencies, the growth of new and exciting DeFi platforms, and innovative offerings such as NFTs, and even fractional NFTs. All of these factors, the hype they generate, and the fact that so many high-profile personalities have endorsed crypto — from rappers to electric car tycoons — has meant that these digital currencies often shoot up in a rapid bullish way. Likewise, however, when there are crypto hacks, moves toward regulation from governments, accusations of increasing centralization, or comments on its negative impact on the climate, drives it in the other direction.

Crypto is in a war of sorts, between trust and mistrust, with its proponents fighting to see it become the new global currency — one that will be in the hands of the people and allow for more freedom. Its opponents either arguing for regulation or convinced that it is a bubble that will eventually burst, leaving many financially ruined. Each of these parties gain traction at different times, which influences the actions of investors, and thus impacts the value of the asset. One only needs to look at the crypto crashes of 2018 and 2021 to see how investors can become spooked by a sudden mass selling off or buying of an asset. After all, it being such a new form of money means that many do not really know much about it.
Crypto Pullbacks vs. Traditional Market Pullbacks
Traditional trading is more established and the assets often more tangible, such as oil, silver, or a company’s stocks, meaning that although often in fluctuation, investors do not see it at such a risk of imploding or on the other side of the coin, of skyrocketing. This means that there is both more nervousness and excitement around crypto trading than there is traditional trading. Investors are at once fearful of losing all of their money and excited at the prospect of becoming overnight millionaires. This ultimately means more nervousness in investors and their actions, and thus more instability in the value of cryptos such as Bitcoin (BTC).
What to Do During a Bitcoin Pullback?
Bitcoin pullbacks are common, which is understandable since BTC is the world’s most popular and most valuable crypto, with a market cap nearing $1 trillion. However, pullbacks on BTC must be approached with caution, with many investors believing that BTC is a long-term investment because of how long these pullbacks can last. Currently, BTC is in a bearish pattern having dropped from its recent ATH of $68,500 in November to a bearish $46,500 to $48,000. However, many top analysts see this as normal levels of volatility for the asset, believing that “once the pullback is completed, there’s a high possibility of Bitcoin bouncing back up and reaching new highs in the new year.”
During a BTC pullback, it is important for the trader or investor to first analyze the pattern and work out when they think the pullback will end. If it looks likely to end soon, then the best option is to follow the steps discussed above and enter the market when the value reaches anywhere between the 50% and 61.8% Fibonacci retracement area. If it seems likely that the pullback will last longer, the investor must decide whether they want to take the risk and wait, which is what BTC pullbacks have indicated is best so far, or whether they want to cut their losses, consider it a reversal, and sell.

Conclusion
Pullbacks are a normal part of any asset’s value fluctuation, and in trading they are an event that if understood correctly and taken advantage of properly, can deliver great profitability. This is the case in both traditional asset trading and cryptocurrency trading, but while both have market pullbacks, trading in these different types of assets is different. Traders must understand that cryptocurrency’s volatility means longer and deeper pullbacks, and so they should be increasingly cautious when deciding whether it is a pullback or actually a reversal. Thankfully, traders can make use of strategies and tools, such as the Fibonacci Retracement tool to help them make the most profitable decision.
Read More
- Pullback vs. Retracement vs. Reversal: What Are The Differences?
- What is a Market Correction? All the 2021 Crypto Market Corrections Explained
- How to use The Trend Reversal Trading Strategy: All you Need to know
- The 2021 Crypto Crashes Explained: What do they Mean for the Future?
- Buy Low, Sell High Crypto: 4 Things To Do (3 To Avoid)
- What is Crypto Market Cycle: Identifying Market Highs
- Uptrends and Downtrends: How to Spot and Trade Them?
- All About Reversal Candles: How to Read and Trade


