


Have you heard traders on Twitter or Telegram talking about the 'John Wick' candle and wondered what they mean? You've come to the right place. The 'John Wick' candle is the popular nickname for one of the most powerful reversal signals in technical analysis: the long wick candlestick. In this guide, we'll break down exactly why it gets its name and how you can trade it like a pro.
In candlestick charts, sometimes the price leaves behind a dramatic “tail” or long wick on a candle. Traders often perk up at these formations because a long wick can signal a potential trend reversal or important shift in market sentiment. But what exactly is a long wick candle, and how do you trade it? Some even playfully call it a “John Wick candle,” a nod to the movie character known for swift reversals, because a long wick often implies the market violently changed direction during that period. Understanding long wick candles is useful for crypto traders because these candles reveal battle between buyers and sellers. They often appear at the climax of a trend: either at the very top of a bullish move or the bottom of a bearish move. In this article, we’ll explain what long wick candles are and why they form, dive into the psychology behind them, show you how to identify them easily, and outline strategies for trading based on these wicks.
What Is a Long Wick Candle?
Traders regard the long wick candlestick pattern as a reversal signal which tends to resolve in the opposite direction of the current prevailing trend. It is one of the most iconic candlestick types, receiving its name due to its long wick attached to the candle body, as shown in the figure below. The green color of the candle’s body means that the closing price is more than the opening price. The red candle signifies the opposite where the opening price is more than the closing price. However, as a reversal signal, the color of the candle does not hold any significance. Instead, the candle’s location plays a significant role in determining whether the candlestick represents a potential bullish or bearish reversal.
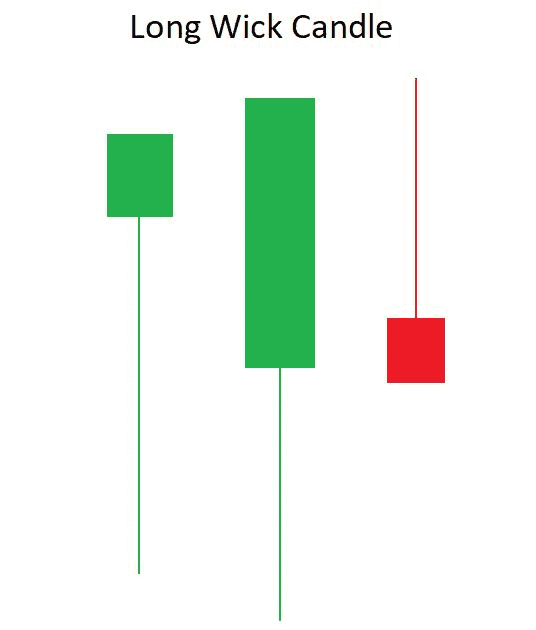
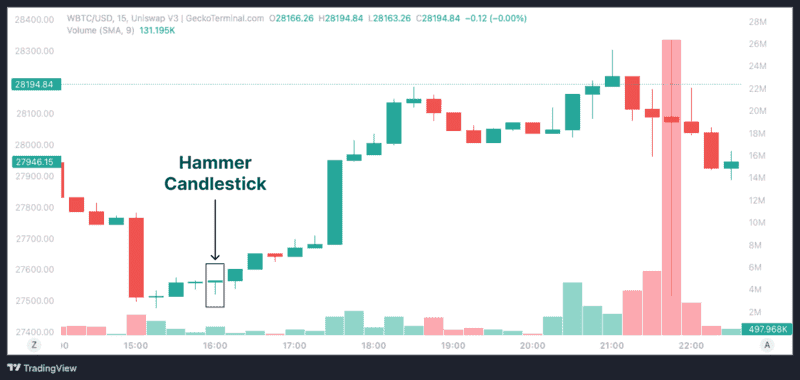
A bullish reversal signal with a long wick is often found at the end of a downtrend. This candle, commonly known as a Hammer, is characterized by a small body at the top, a small (or non-existent) upper shadow, and a long lower shadow (wick). It signifies that sellers pushed the price down, but buyers stepped in forcefully to close the price near its high.
In contrast, a bearish reversal signal with a long wick appears at the end of an uptrend. This candle, often called a Shooting Star, has a small body at the bottom, a small (or non-existent) lower shadow, and a long upper shadow (wick). It indicates that buyers tried to push the price higher but failed as sellers took control, pushing the price back down.
Why Is It Called the "John Wick" Candle?The Brutal Psychology Behind the Name
In the vast and often dry world of technical analysis, filled with terms like "stochastic oscillators" and "Bollinger bands," a name like the "John Wick" candle stands out. It’s visceral, modern, and immediately sparks curiosity. But this isn't just a random, catchy nickname; it's a surprisingly perfect metaphor for the violent and decisive market action this candlestick represents.
To understand the name, you have to understand the character: John Wick.
Portrayed by Keanu Reeves in the blockbuster film series, John Wick is not just a hitman; he is the hitman you send to eliminate other hitmen. He is a force of nature, a one-man army known for his brutal efficiency, relentless focus, and an uncanny ability to turn an impossible situation completely on its head. When he enters a fight, the direction of the battle changes—instantly and violently.
Now, let's translate that character profile onto a price chart.
The "John Wick" candle captures this exact narrative. It represents a moment of extreme conflict in the market, culminating in a swift and merciless rejection that leaves one side decimated. Let's break down the analogy piece by piece:
1. The Long Wick = The Weapon of Rejection
The most prominent feature of the candle is its long wick (or shadow). This wick is not just a line on a chart; it is a scar—a visual record of a brutal battle.
-
In an uptrend (Bearish "John Wick" / Shooting Star): The long upper wick shows that the bulls pushed the price aggressively higher during the session. They were confident, in control, and storming the castle. But then, they hit a wall of overwhelming force. The bears (sellers) not only stopped their advance but brutally drove them all the way back down, leaving a trail of destruction in the form of a long wick. It was a massacre.
-
In a downtrend (Bullish "John Wick" / Hammer): The long lower wick tells the opposite story. The bears were in complete command, pushing the price to new lows. Panic was setting in. But suddenly, an immense wave of buying power entered the market. The bulls didn't just absorb the selling pressure; they launched a ferocious counter-attack, driving the price all the way back up.
In both cases, the long wick is the weapon. It signifies a total and complete rejection of the prevailing trend's advance.
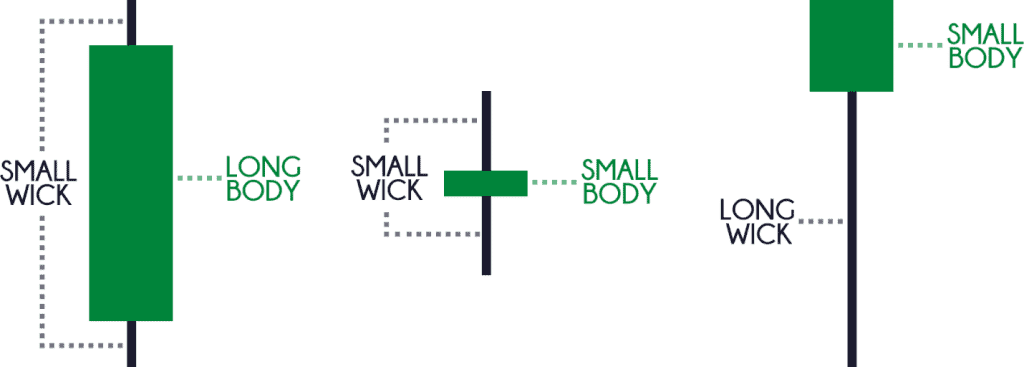
2. The Small Body = The Professional Hitman's Efficiency
A classic John Wick candle has a relatively small real body compared to its wick. This is crucial. It shows that despite the massive price volatility during the session (the full length of the wick), the opening and closing prices were very close together.
This isn't a long, drawn-out battle. It’s a professional hit. The fight was brought to one side, and it was ended decisively within the same period. The small body represents the efficiency and precision of the reversal. It tells you that the counter-attacking force was so strong that it almost completely erased the progress made by the dominant trend, finishing the job cleanly.
3. The Result = A Brutal and Decisive Reversal
When John Wick finishes a fight, there is no ambiguity about who won. The same is true for the candle that bears his name. It is a signal of a potential high-probability reversal.
The psychology it creates is powerful:
-
Traders who were confidently riding the trend are now trapped and in losing positions.
-
Traders who were waiting on the sidelines see a clear signal that the balance of power has shifted.
-
The market has just witnessed a display of overwhelming force from the opposing side.
This is why traders have adopted the name. It perfectly encapsulates the feeling of watching a price chart when one of these candles appears. It's not just a technical pattern; it's a story of a swift, brutal, and decisive victory—a "John Wick" moment that changes everything. Understanding this narrative behind the name is the first step to trading it effectively.
Psychology Behind Long Wick Candles
Long wick candles reveal market psychology within a single bar, with both bullish and bearish interpretations.
-
Bullish Long Wick (Long Lower Shadow): This occurs in a downtrend when sellers initially drive the price down sharply. However, buyers step in, pushing the price back up by the close, indicating rejection of lower prices. This shift suggests the end of the downtrend, signaling potential buying opportunities. For instance, if Ether drops from $2000 to $1800 but closes at $1970, it shows buyers found value at $1800.
-
Bearish Long Wick (Long Upper Shadow): In an uptrend, this pattern forms when buyers push prices up but sellers retaliate, leading to a close near the open. This signifies that buyers lost momentum and sellers regained control. For example, if Bitcoin jumps from $30k to $33k only to close at $30.5k, it indicates hesitation among buyers.
-
Spinning Top Candles (Both Wicks Long): This pattern features long wicks on both ends with a small body, signifying indecision and often preceding trend changes. Traders look for confirmation from the next candle to determine direction.
Understanding long wick candles helps prevent rash decisions and underscores the importance of confirmation. They serve as alerts for tightening stops, taking profits, or reversing positions, allowing traders to navigate emotional market swings effectively.
What If the A Candlestick Has Two Long Wicks?
A Spinning Top
Some candlesticks have both very long upper and bottom shadows, as shown in the figure below. However, this candlestick is not regarded as long wick candlesticks. Instead, this candlestick pattern is called the “spinning top.” Generally, the candle body is small. The lengths of the upper and bottom shadows are also typically not equal, but there are scenarios where it can be difficult to ascertain the length difference.
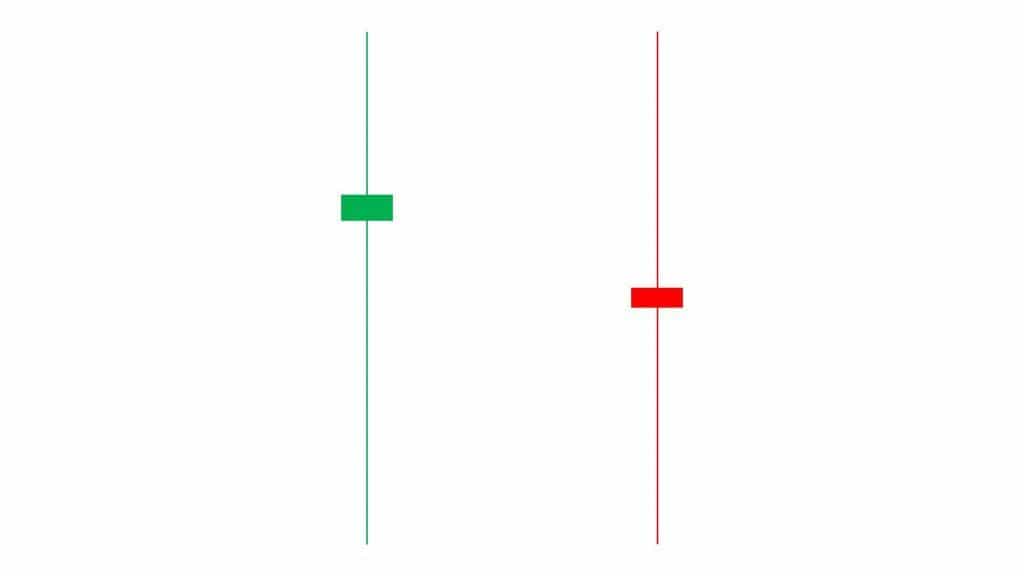
The appearance of a spinning top signifies indecision from buyers and sellers as the long upper and bottom shadows indicate an absence of meaningful price change. The spinning top hints that the market trend will change by either reversing in direction or moving into a sideways trend. If the spinning top is a reversal signal, a green spinning top will signify a potential bullish reversal, while a red spinning top would indicate a potential bearish signal.
How To Recognize the Long Wick Candlestick?
Bullish Long Wick Candlestick
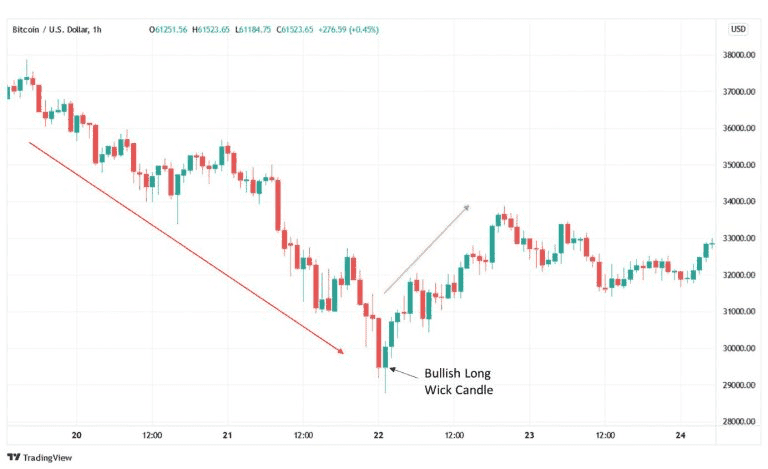
From the figure below, a long wick candlestick is located after a downtrend where the price fell from around $37,000 to about $29,500. The appearance of a long wick candlestick here is a potential bullish reversal signal, meaning that the asset is forming a bottom, which may be followed by a price increase. The long wick below the candle body signifies that sellers tried to push the price down significantly, but the buyers managed to push the price back up. The buyers did so by showing considerable buying strength, which will carry forward and lead to a price increase. In this example, the asset’s price did increase after the appearance of the long wick candlestick and rose to around $33,500.
Bearish Long Wick Candlestick
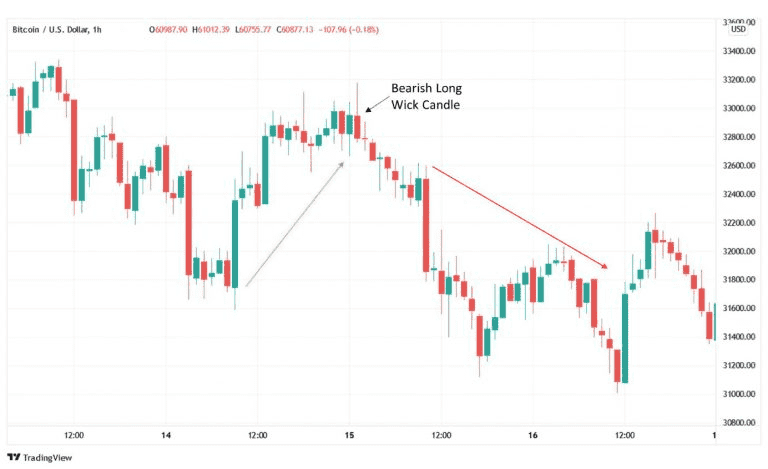
From the figure below, a long wick candlestick is located after an uptrend where the price rose from around $31,700 to about $32,900. The appearance of a long wick candlestick here is a potential bearish reversal signal that means that the asset is forming a top, which may be followed by a price drop. The long wick above the candle body signifies that buyers tried to overpower the sellers but failed. The sellers managed to drive the price downwards, and their momentum will carry forward into a price decrease. In this example, the asset’s price did decrease after the appearance of the long wick candlestick and fell to around $31,100.
How Long is "Long Enough"? A Rule of Thumb
A common question traders have is how to determine if a wick is truly "long" enough to be significant. While there's no official rule, a widely accepted guideline is that the wick should be at least two to three times the length of the candle's body.
-
Strong Signal: If the wick is 3x the size of the body, it's a strong rejection signal.
-
Weak Signal: If the wick is only slightly longer than the body, its significance is diminished and should be treated with caution.
The longer the wick, the more dramatic the price rejection and the more powerful the potential reversal signal.
How to Trade the "John Wick" (Long Wick) Candle Strategy
Once traders can regularly spot the long candlestick patterns, they should consider how to enter or exit the market and place their Stop Loss or Take Profit orders. As the crypto market is volatile, the Stop Loss or Take Profit order should not be too close to the entry price, or else it will trigger too quickly.
In long wick candlestick trading, the location of the Stop Loss order is typically placed near the closing price of the candle. The rules for the placement of Take Profit orders are slightly more complex. The location of Take Profit orders for the bullish or bearish long wick candlestick are different and depend on the resistance and support levels. The details about the resistance and support levels are as follows:
-
The resistance level is the level where an uptrend pauses temporarily due to a concentration of supply from sellers. It is also known as the price ceiling. Traders should place their Take Profit orders around the resistance level when trading bullish long wick candle sticks.
-
The support level is a level where a downtrend pauses temporarily due to a concentration of demand from buyers. It is also known as the price floor. Traders should place their Take Profit orders around the support level when trading bearish long wick candle sticks.
When is the best time to trade on a long wick candle?
Traders should keep in mind not to immediately enter a trader after spotting the long wick candlesticks. Instead, traders should wait for further confirmation from technical indicators, oscillators, or other trading tools to confirm the trend reversal to avoid unnecessary losses. Traders can also change the time frame of the chart depending on their trading strategy. Day traders can choose shorter time frames of 5 minutes or 15 minutes to quickly trade the price changes. For most traders, longer time frames of at least 1 hour are enough. Novice traders are recommended to practice their trading techniques on simulation trading platforms, followed by trading small volumes to get used to long wick candle trading before moving on to trading large volumes on cryptocurrency exchanges.
Trading on a Bullish Long Wick Candlestick
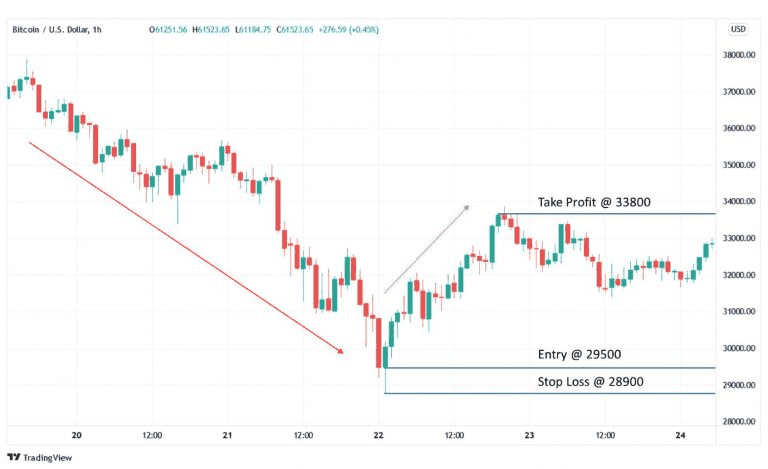
The figure below is an example of how to enter a market after the appearance of a bullish long wick candlestick. The corresponding steps are as follows:
-
The trader identifies a bullish long wick candle at the end of a bearish trend. The candle is characterized by its long bottom shadow.
-
The trader places an order around the closing price of the identified long wick candlestick at around $29,500 and prepares to go long.
-
To limit losses, the trader places a Stop Loss order at the low end of the long wick candlestick. In this case, the Stop Loss order is placed at around $28,900.
-
The trader places a Take Profit order. Since this uptrend is reversing, the target should be set at a logical support level. This could be the previous swing low in the uptrend or the next major area of historical price support. In this scenario, the support level is located at around $31,350.
Trading on a Bearish Long Wick Candlestick
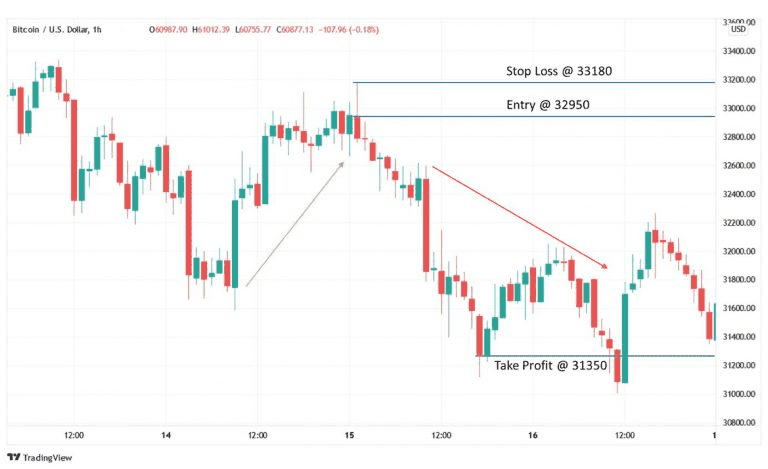
The figure below is an example of how to exit a market after the appearance of a bearish long wick candlestick. The corresponding steps are as follows:
-
The trader identifies a bearish long wick candle at the end of a bearish trend. The candle is characterized by its long upper shadow.
-
The trader places an order around the closing price of the identified long wick candlestick at around $32,950 and prepares to go short.
-
To limit losses, the trader places a Stop Loss order at the high end of the long wick candlestick. In this case, the Stop Loss order is placed at around $33,180.
-
The trader places a Take Profit order. Since this uptrend is reversing to a bearish trend, traders should place the Take Profit order around the support level. In this scenario, the support level is located at around $31,350.
Limitations of the Long Wick Candle Strategy
While long wick candles can provide useful signals, there are certain situations where caution is warranted:
-
Low Liquidity & Erratic Markets: In thinly traded assets or during off-peak hours, long wicks may be mere noise rather than true reversal signals, often caused by single large orders. Be wary of relying on wicks in low-volume situations.
-
Lack of Trend Context: The significance of a long wick diminishes in choppy or range-bound markets. Only consider long wicks as signals following a sustained trend.
-
No Confirmation: Acting solely on a long wick can be risky. It's advisable to wait for confirmation (like a higher or lower close) before making a trade.
-
Near Major News Events: Be cautious if long wicks form around significant news. Initial reactions can be misleading and the market may revert back afterward.
-
Ignoring Other Indicators: Don’t rely on wicks alone, as you should always consider other indicators and market contexts. If other signals contradict the wick, approach with skepticism.
-
Extreme Volatility: In highly volatile markets, multiple long wicks may appear in both directions, making it hard to identify reversals. Use wider confirmation criteria or refrain from trading.
-
Not a Guaranteed Reversal: Remember that long wicks indicate potential reversals, not certainties. Strong trends can continue despite the appearance of a long wick.
In essence, don’t use the long wick candle strategy in isolation or in unsuitable conditions. It’s a handy tool, but it works best as part of a well-rounded trading approach. If the conditions aren’t right or the signal is muddy, it’s perfectly fine to pass on the trade. There will always be another opportunity.
Conclusion
Trading on long wick candlesticks can be very profitable if traders can reliably identify them by adhering to the identification rules. A bullish long wick candle is usually at the end of a downtrend, while a bearish long wick candle is typically at the end of an uptrend. By learning to recognize bullish long wicks (hammers) and bearish long wicks (shooting stars), and understanding the tug-of-war between bulls and bears that creates them, you can anticipate potential reversals with greater confidence. However, like all trading strategies, long wick candlestick trading involves a certain degree of risk. A long wick candle is only a signal that indicates there is a possibility of a trend reversal and does not guarantee that the reversal will happen. Thus, traders are advised to combine the pattern with other available trading tools and practice with such tools before utilizing them in trades.
To truly trade crypto like a pro using strategies like long wick candles, you need a reliable and feature-rich trading platform. Phemex is an excellent choice for this. It’s a top-tier crypto exchange that offers both spot trading and futures trading, so you can capitalize on bullish or bearish signals with ease. If you spot a long wick reversal and want to automate your entry or exit, Phemex provides advanced trading bots and tools to help execute your strategy even when you’re away. Managing risk is crucial with any reversal trade and Phemex’s interface lets you set stop-loss and take-profit orders seamlessly when you open a position.