

Introduction: The Song of Euphoria and the Peril of Icarus
Every crypto bull market has a soundtrack. It begins as a low hum of optimism, builds into a chorus of excitement, and crescendos into a deafening symphony of euphoria. It’s in this final, exhilarating phase that fortunes are made overnight, mainstream media broadcasts tales of teenage Dogecoin millionaires, and your taxi driver starts offering you altcoin tips.
It is also the most dangerous time to be an investor.
Like Icarus flying too close to the sun, the intoxicating warmth of a parabolic market advance often masks the imminent, catastrophic fall. The single greatest challenge for any trader or investor is not identifying a bull market, but recognizing when it is nearing its exhaustive peak. Calling the exact top is a fool's errand, a game of luck rather than skill. However, identifying the high-risk "red zone"—the period where probabilities dramatically shift against you—is a critical skill that separates seasoned professionals from retail exit liquidity.
This guide is not a crystal ball. It is a dashboard. We will not provide a single magic number that screams “sell.” Instead, we will equip you with a multi-faceted framework of on-chain data, technical indicators, and sentiment analysis. As a seasoned analyst, I can tell you that no single indicator is infallible. The true art lies in seeking confluence—the moment when multiple, independent indicators all begin flashing red.
Welcome to your 2025 guide to identifying the crypto bull market peak.
On-Chain Data – Looking Through the Glass House of the Blockchain
Unlike traditional markets, the blockchain offers a transparent, immutable ledger of economic activity. By analyzing this data, we can gauge the underlying health and psychology of the market far more accurately than ever before. These are three of the most powerful on-chain indicators for spotting market tops.
1. MVRV Z-Score (Market Value to Realized Value)
-
What It Is: The MVRV Z-Score is a classic indicator used to assess when Bitcoin is over or undervalued relative to its "fair value." It compares the Market Value (current price x circulating supply) to the Realized Value (the price of each Bitcoin when it was last moved on-chain).
-
The Analogy: Think of Market Value as the "sticker price" of the entire network. Realized Value is the "average cost basis"—what everyone collectively paid for their coins. The Z-Score measures how stretched the sticker price is from the average cost.
-
How to Use It for Peaks: The MVRV Z-Score chart has historically been incredibly reliable at identifying market cycle tops. It features a red horizontal band at the top of the chart. When the Z-Score enters this red zone (typically a value above 7.5), it signals that the market is in a state of extreme euphoria and overvaluation. Every major Bitcoin bull market peak in history has coincided with the MVRV Z-Score entering this zone.
-
What It Tells You: A red-hot MVRV Z-Score indicates that the average holder is sitting on massive unrealized profits. This creates immense latent sell pressure. The higher it goes, the more incentive long-term holders have to take profits, increasing the probability of a major market reversal.
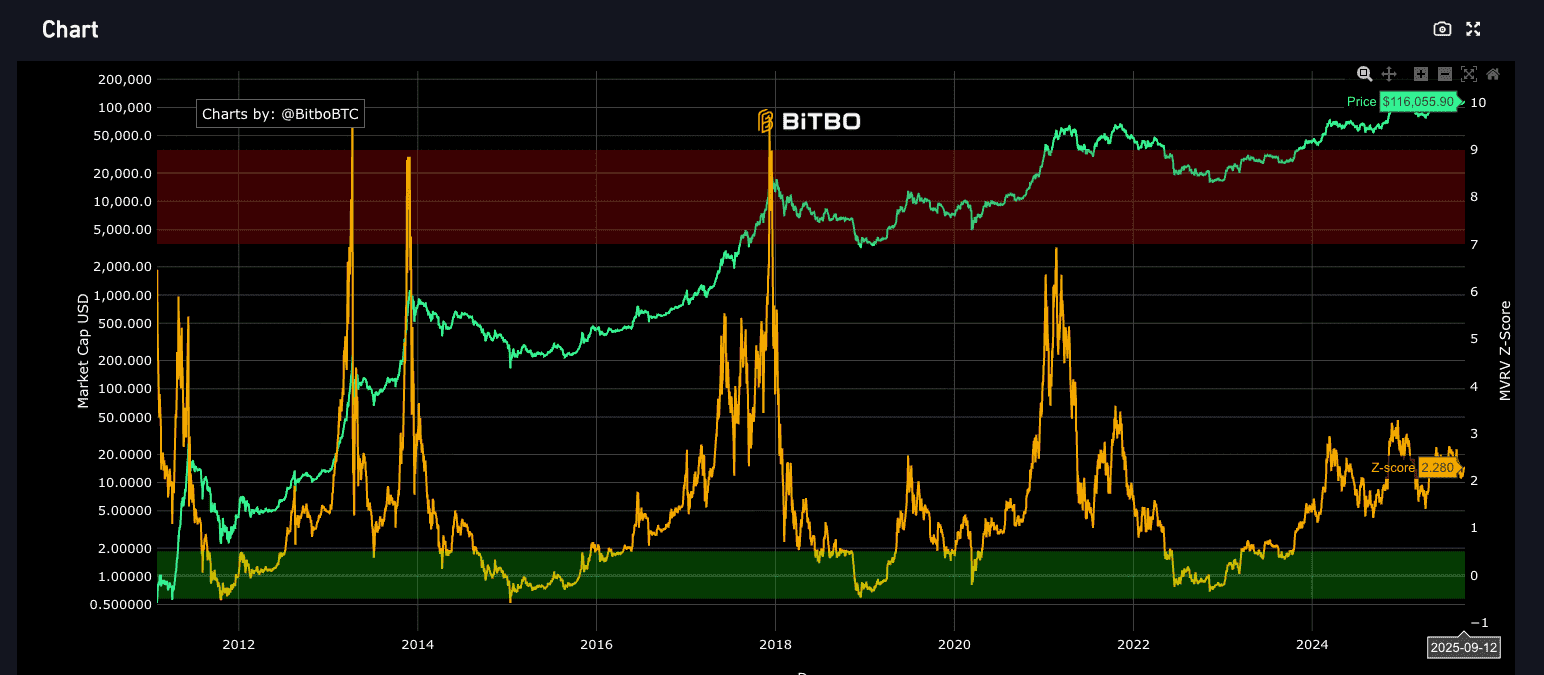
MVRV Z-Score(Bitcoin)Source:Bitbo
2. NUPL (Net Unrealized Profit/Loss)
-
What It Is: NUPL is perhaps the purest gauge of market sentiment encoded on the blockchain. It measures the total amount of profit or loss in the system. Specifically, it’s the difference between the Market Cap and Realized Cap, divided by the Market Cap.
-
The Analogy: If the entire Bitcoin network were one giant trading position, NUPL tells us if that position is in profit or loss, and by how much.
-
How to Use It for Peaks: The NUPL chart is color-coded into distinct psychological zones. The one we care about for market tops is the blue "Euphoria" zone (a value above 0.75). When NUPL enters this zone, it signifies that the network as a whole is sitting on extreme, almost irrational, unrealized profits.
-
What It Tells You: The "Euphoria" phase is the final stage of a bull market. Greed has turned into delusion, and new participants are buying in at any price, convinced it will go up forever. This is the definition of a speculative bubble. While the market can remain in the Euphoria zone for several weeks, its presence is a clear signal that the cycle is in its final innings.
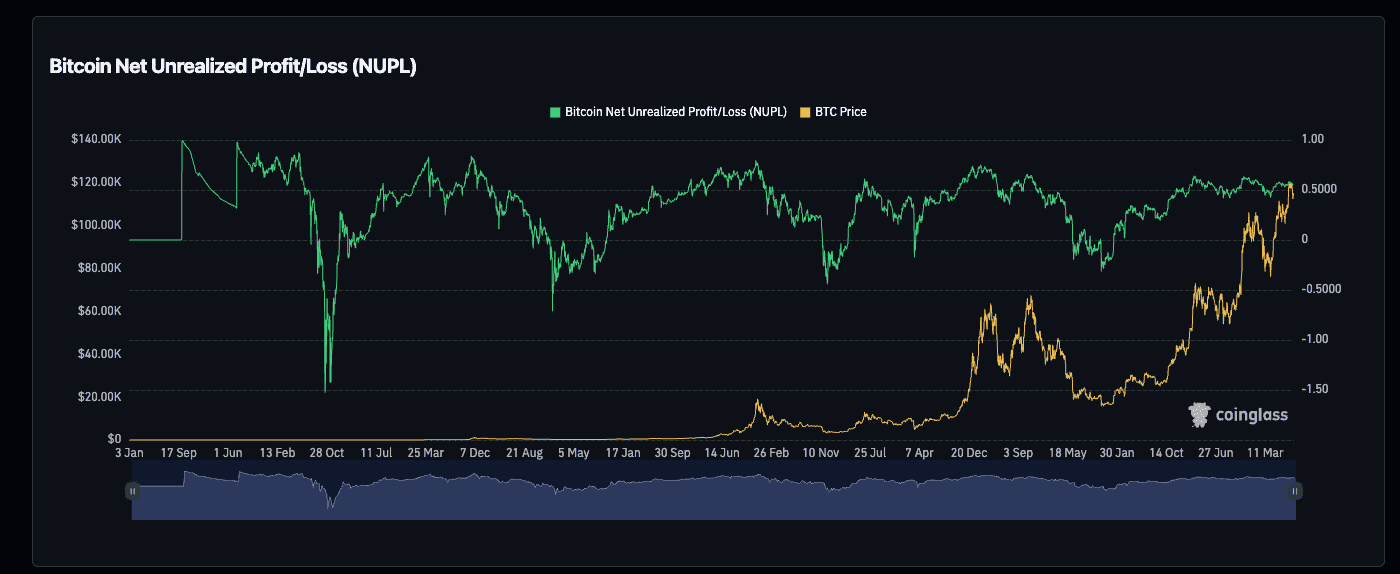
Bitcoin Net Unrealized Profit/Loss (NUPL), Source:Coinglass
3. The Puell Multiple
-
What It Is: The Puell Multiple looks at the supply side of the Bitcoin economy—the miners. It's calculated by dividing the daily coin issuance value (in USD) by the 365-day moving average of the daily issuance value.
-
The Analogy: Think of this as a "Miner Profitability Index." It compares the revenue miners are making today to the average revenue they made over the last year.
-
How to Use It for Peaks: Similar to the MVRV Z-Score, the Puell Multiple chart has a red "sell" zone at the top. When the multiple enters this zone (typically a value above 4.0), it indicates that current miner profitability is exceptionally high compared to the yearly norm.
-
What It Tells You: Miners are rational economic actors. When their profitability is 4-10 times higher than the yearly average, their incentive to sell their newly mined Bitcoin to lock in those exceptional profits is immense. This massive increase in sell-side pressure from the network's producers has historically coincided with macro market tops.
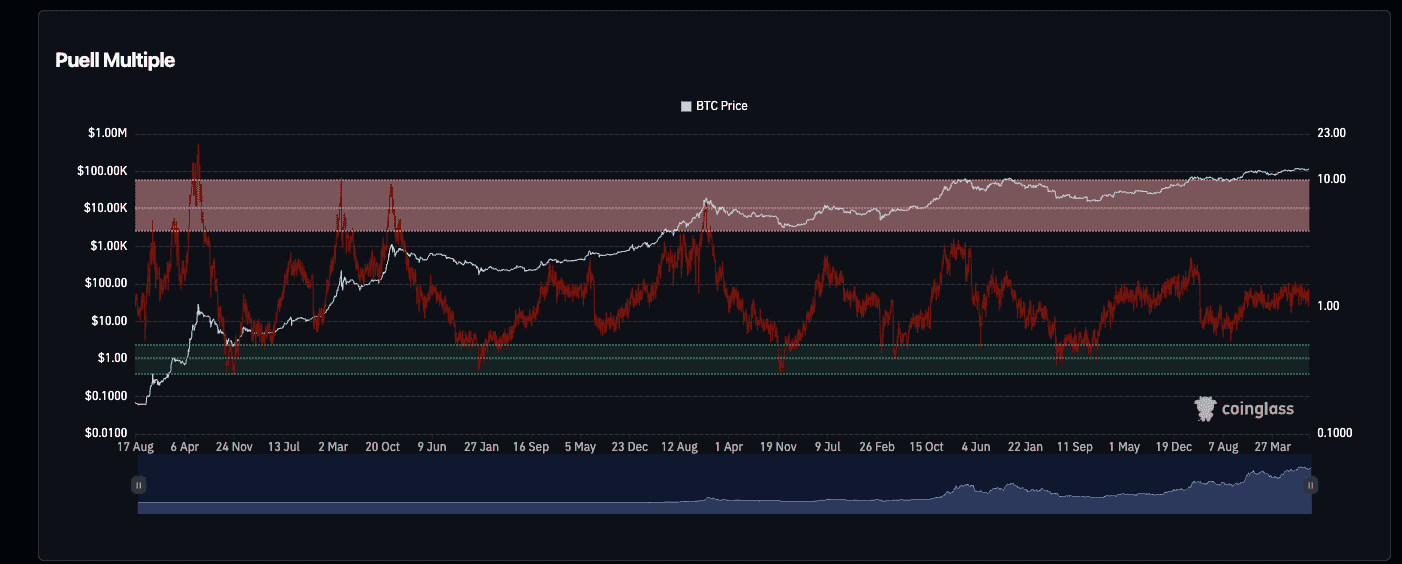
Puell Multiple, source: Coinglass
Technical & Market Structure Indicators – The Story the Chart Tells
On-chain data gives us the fundamental picture, but the price chart itself tells a story of human psychology—of greed and fear translated into candlesticks.
4. Bitcoin Dominance (BTC.D) and the Flow of Capital
-
What It Is: Bitcoin Dominance is the ratio of Bitcoin's market capitalization to the total cryptocurrency market capitalization. It's a measure of Bitcoin's "market share."
-
How to Use It for Peaks: The end of a bull market often follows a predictable pattern of capital rotation:
-
Phase 1: Bitcoin rises sharply. Money flows into BTC, and BTC.D increases or stays high.
-
Phase 2: Ethereum and other large-cap majors start to outperform Bitcoin. Capital begins to rotate out of BTC, and BTC.D starts to fall.
-
Phase 3 (Altcoin Season): The real mania begins. Capital floods into mid-cap and low-cap altcoins, often with parabolic, 100x-style gains. During this phase, BTC.D plummets.
-
The Warning Sign: The peak of the bull market often occurs when this altcoin mania reaches its zenith. The key signal is when BTC.D stops falling, finds a bottom, and begins to sharply reverse upwards. This indicates a "flight to safety" as smart money starts selling their altcoins and moving back into the relative safety of Bitcoin or stablecoins, just before the entire market collapses.
-
-
What It Tells You: Watching the explosive, irrational pumps of low-cap altcoins while BTC.D is simultaneously bottoming out is one of the strongest signs that the party is over.
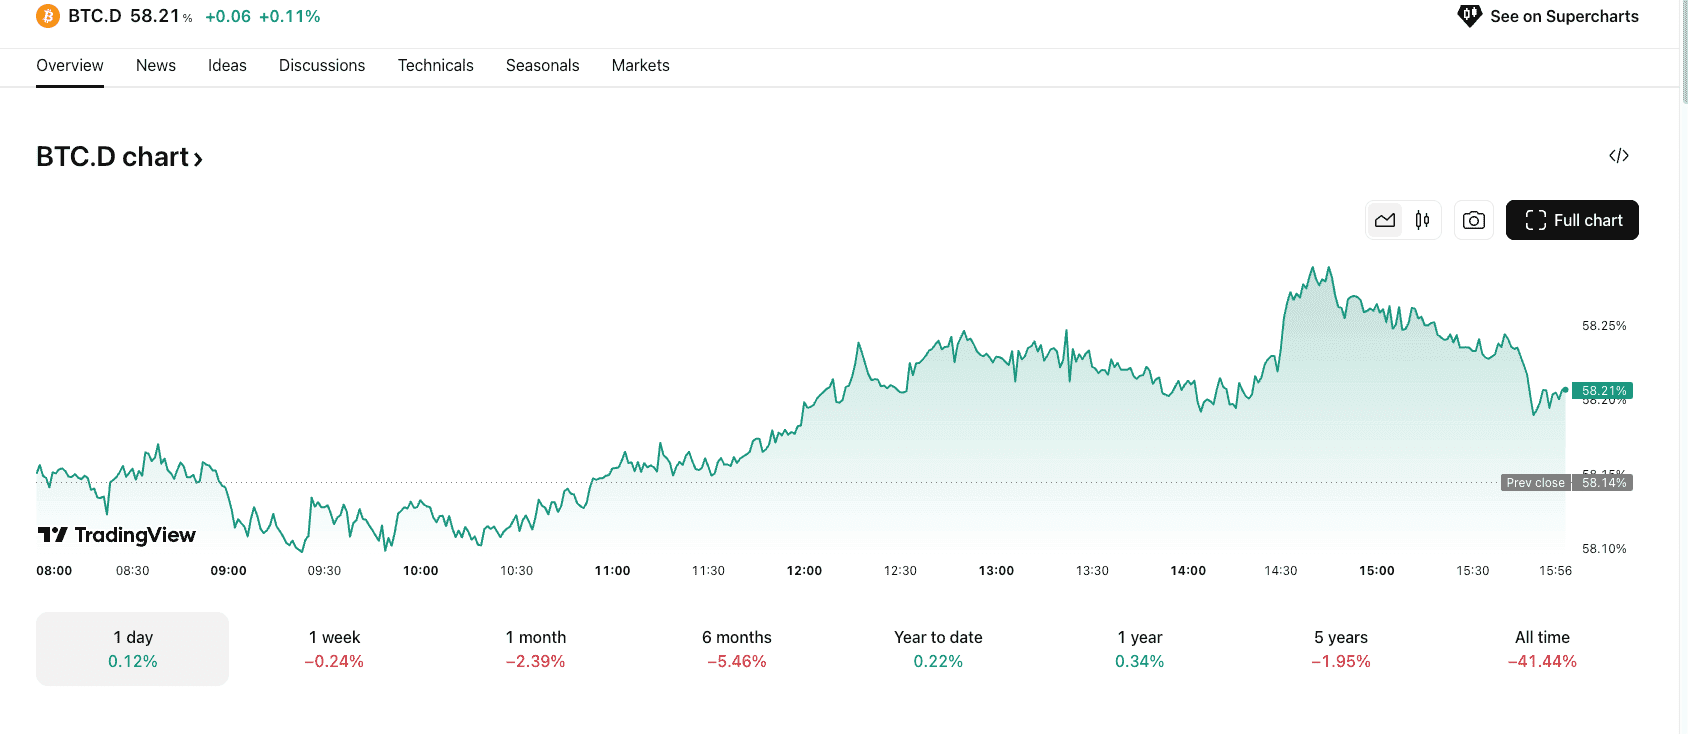
Bitcoin Dominance (BTC.D) Chart, source: TradingView
5. Logarithmic Growth Curves & Blow-Off Tops
-
What It Is: Over its lifetime, Bitcoin's price has largely remained within a long-term logarithmic growth channel. This channel has historically defined the over-extended peaks and capitulation bottoms of its major cycles.
-
How to Use It for Peaks: A major warning sign is when the price of Bitcoin rapidly accelerates and touches the top band of this logarithmic channel. This move is often characterized by a "blow-off top" on the chart—a series of massive green candles with ever-increasing volume, culminating in a final exhaustive spike.
-
What It Tells You: This pattern represents the final wave of public buying. It's the moment of "maximum FOMO," when all remaining sideline capital finally capitulates and buys in, just as the smart money is finishing their distribution (selling). A touch of the upper logarithmic band has marked the peak of every previous cycle and should be seen as a five-alarm fire warning.
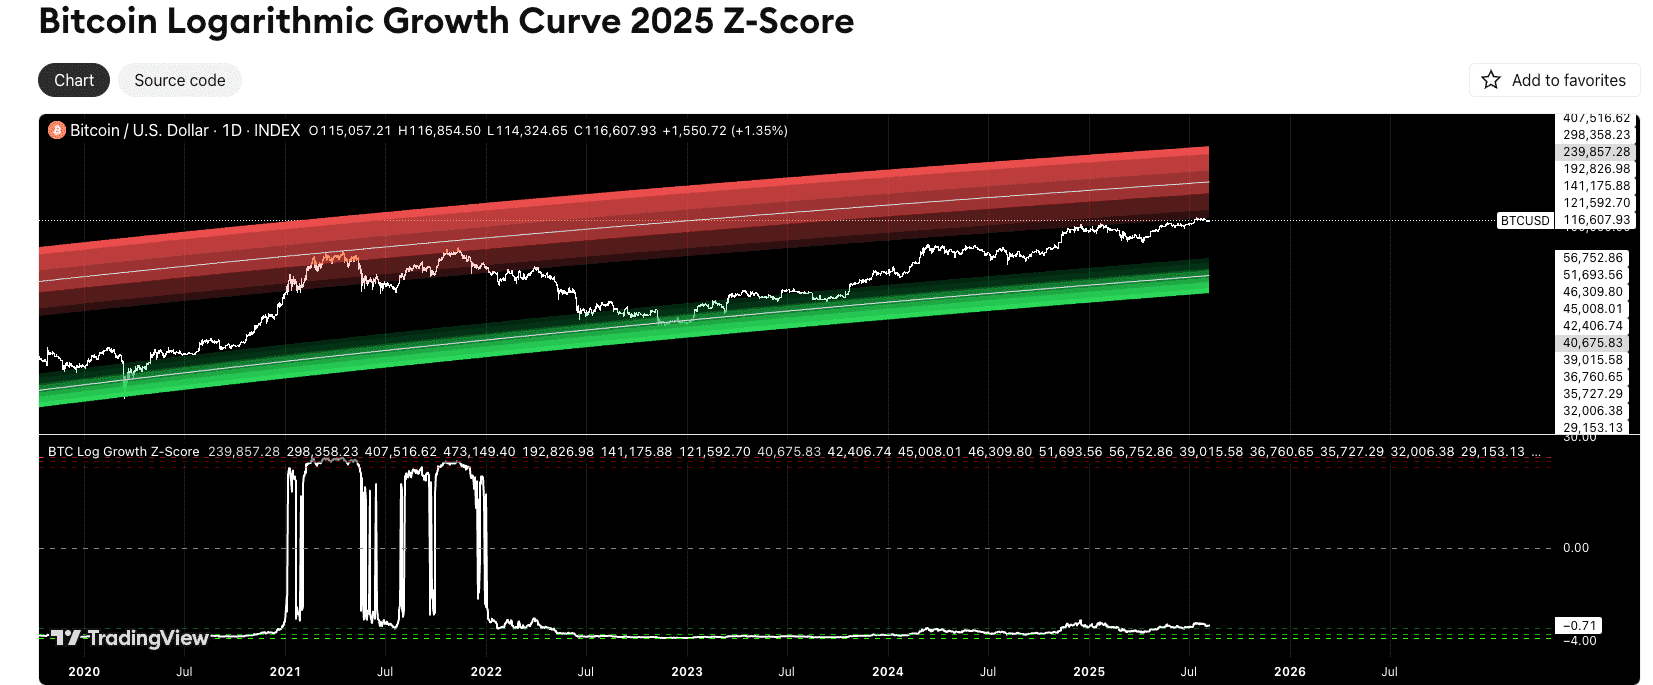
Bitcoin Logarithmic Growth Curve 2025 Z-Score, source: TradingView
Sentiment & Macro Indicators – Gauging the Human Element
Finally, we must step away from the charts and look at the world around us. Markets are driven by people, and their collective psychology leaves clear tells.
6. The "Main Street" Euphoria Metric
-
What It Is: This isn't a quantifiable metric but a qualitative observation of societal sentiment. It's the point where crypto transcends its niche and becomes a dominant cultural conversation.
-
How to Use It for Peaks: You know the market is at or near a peak when you see the following signs concurrently:
-
Media Saturation: Major news outlets like CNN and BBC are leading their broadcasts with Bitcoin price stories.
-
Celebrity Endorsements: Actors, musicians, and athletes are suddenly shilling altcoins on their social media.
-
The "Barber Tip": When people in your daily life who have never shown interest in finance start giving you crypto tips.
-
ICO/IDO Mania: A flood of new, often low-quality, projects are raising millions of dollars in minutes, with their tokens pumping 100x on launch.
-
-
What It Tells You: This is a classic sign of a market top described by legendary investors for centuries. It means that everyone who could possibly buy has already bought in. There is no new money left to push the price higher, leaving the market incredibly vulnerable to a reversal.
Putting It All Together: The Peak Spotter's Dashboard
Remember, no single indicator is a sell signal. A professional trader looks for confluence. As the 2025 bull market matures, build this mental dashboard and watch for these signals to light up.
| Indicator Category | Indicator | Red Flag Signal (Market Peak is Near) |
| On-Chain | MVRV Z-Score | Enters the upper red zone (>7.5) |
| On-Chain | NUPL | Enters the blue "Euphoria" zone (>0.75) |
| On-Chain | Puell Multiple | Enters the upper red zone (>4.0) |
| Technical | BTC Dominance | Reaches a multi-month low and begins to sharply reverse upwards |
| Technical | Price Chart | Price touches the top band of the long-term logarithmic growth curve |
| Sentiment | Main Street | Extreme euphoria: media saturation, celebrity shilling, "barber tips" |
When you see four or more of these indicators flashing red simultaneously, the probabilities have shifted dramatically. It is no longer a time for aggressive buying; it is a time for disciplined profit-taking and rigorous risk management.
Conclusion: From Greed to Prudence
Navigating a crypto bull market is a masterclass in emotional control. The journey to the peak is thrilling, but the euphoria it generates is a siren song, luring unprepared investors towards the rocks of a devastating bear market.
By learning to read these indicators, you are learning to separate signal from noise. You are training yourself to be objective when everyone else is being emotional. You are shifting your mindset from one of pure greed to one of strategic prudence.
The goal is not to sell the exact top—it's to sell well. It's to systematically take profits in the high-risk "red zone" so that when the music stops, you are not left without a chair. Use this dashboard, stay disciplined, and you will be well-equipped to not only survive but thrive in the exhilarating cycles of the crypto market.
Disclaimer: This article is for informational purposes only and should not be considered financial advice. Cryptocurrency trading involves significant risk. Always do your own research and consult with a professional financial advisor before making any investment decisions. Explore Phemex Academy to learn more about advanced trading concepts and risk management.