
XRP Price Snapshot — June 3, 2026
- XRP price: $1.21
- 1-week change: −8.11%
- 24-hour change: +0.83% (intraday recovery candle)
- Market cap: $75.6B (−4.71%)
- 24h volume: $3.14B (+38.81%)
- Volume / market cap: 4.15%
- FDV: $121.84B
- Circulating supply: 61.97B of 100B max
- Holders: 532.64K
The headline is that XRP price has bled roughly 8% over the past seven sessions and now trades at $1.21, well below its February high near $1.30. The more interesting line in the dashboard, however, isn't price — it's the +38.81% surge in 24-hour volume. That's the data point traders need to unpack before deciding whether this is the start of a deeper leg lower or the late stages of an exhaustion flush.
This article is a focused technical and flow read on the XRP price right now. It deliberately sets aside the escrow-unlock and corporate-treasury narratives covered elsewhere on Phemex and zooms in on what the chart and the order flow are actually saying.
Why Is XRP Price Down This Week?
There is no single catalyst behind the 8.11% weekly drop. The decline looks structural rather than headline-driven: every short-term moving average has rolled over, momentum oscillators have crossed below zero, and broader large-cap altcoin liquidity has been rotating into other narratives. When traders ask "why is XRP price down today?" the honest answer is that the market is in a distribution regime — sellers are dominant, but the moves are orderly, not panicked.
Three forces stand out on the chart:
- Lower highs since February. XRP rejected the $1.30 zone in early Feb and has printed a sequence of progressively lower swing highs through March, April, and May.
- Compressing range. Recent daily candles are sitting inside a tight $1.20–$1.22 band — the kind of compression that almost always resolves with a directional impulse.
- Volume rising into weakness. A +38.81% 24h volume expansion as price drifts lower is the textbook footprint of late-cycle capitulation or hedging flows, not fresh bullish accumulation.
XRP Technical Analysis: What the Indicators Are Saying
The dashboard surfaces five indicators that together describe a market with weak momentum but stretched downside conditions. Read in combination:
1. ALMA (9, 0.85, 6) sitting at $1.28
The Arnaud Legoux Moving Average smooths recent price action with less lag than a standard EMA. Spot price ($1.21) is currently trading about 5.4% below the ALMA — a clear bearish trend signal. For XRP to flip back to a neutral structure, bulls need a daily close back above $1.28.
2. CRSI at 55.62
Connors RSI prints 55.62 — squarely in neutral territory, neither overbought nor oversold. That's important: it means the sell-off hasn't reached the kind of statistical extreme (sub-30) that historically marks tradable bottoms. XRP can keep grinding lower without triggering an oversold bounce signal.
3. MACD (12, 26, close 9): −0.01268 / −0.03823 / −0.02555
The MACD line at −0.01268 is below the signal line at −0.03823, with the histogram negative. The configuration is bearish but flattening — momentum is still down, but the rate of acceleration is slowing. This is the pattern that often precedes either a small relief rally or a sideways base — rarely an immediate vertical move in either direction.
4. Awesome Oscillator at −0.01566
The AO sitting in negative territory reinforces the MACD read: momentum is below zero, sellers are in control, but the absolute magnitude is small. A move back above zero would require a daily close above roughly $1.24–$1.25.
5. Coppock Curve at −14.72
This is the most striking number on the chart. The Coppock Curve — historically used to identify major cycle bottoms in equities and large-cap crypto — is at −14.72, deep in negative territory. Coppock prints this far below zero are uncommon and have, in past cycles for major-cap assets, marked multi-month bottoming zones rather than continuation zones. It does not call the exact low, but it tells traders that the probability distribution of long-term outcomes is starting to skew more constructive, even as short-term price stays weak.
The synthesis: short-term momentum is bearish, intermediate trend is bearish, but long-cycle indicators are flashing exhaustion. That combination historically rewards patience over chasing in either direction.
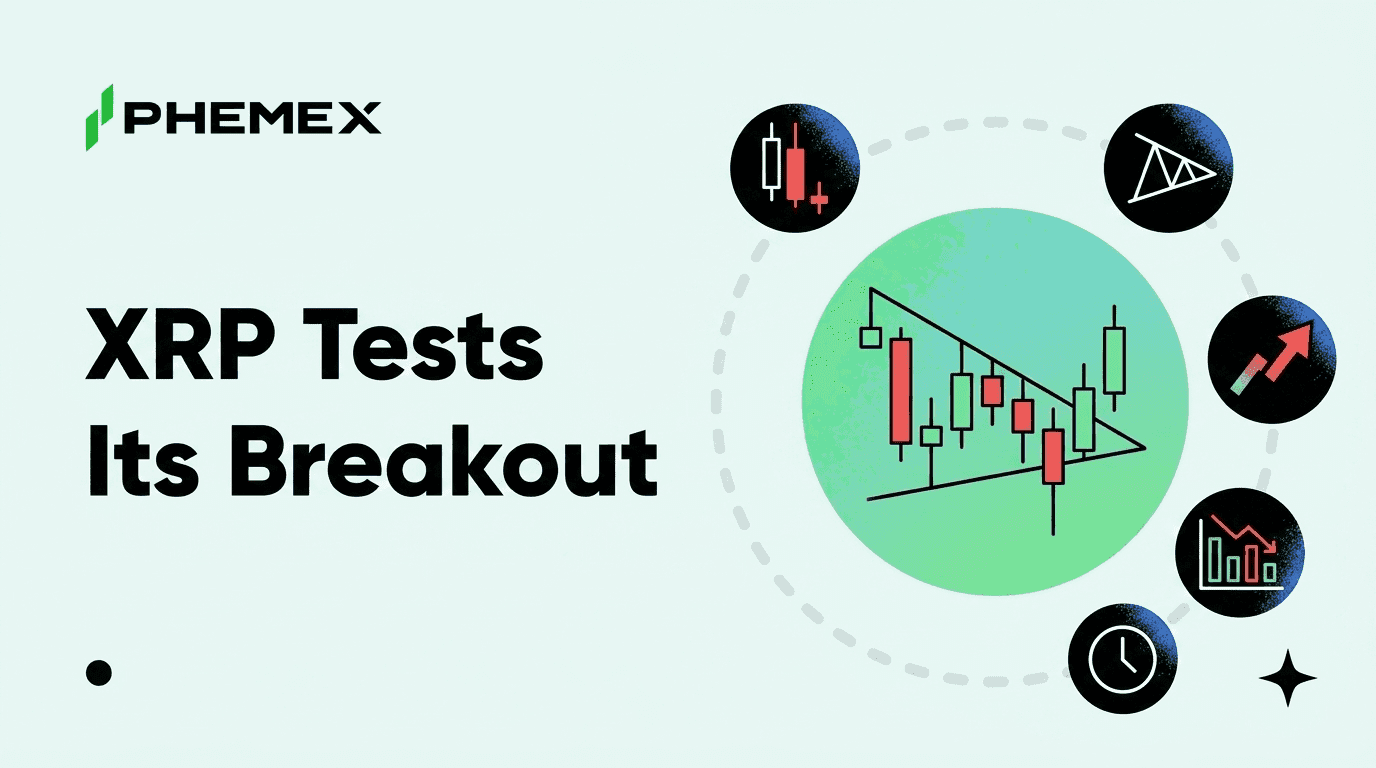
Key Support and Resistance for XRP Price
Reading the daily structure off the chart:
- Immediate resistance: $1.22 (intraday high) → $1.28 (ALMA) → $1.30 (Feb swing high)
- Immediate support: $1.20 (daily low and round-number magnet) → $1.18 (May swing low) → $1.12 (April demand zone)
- Range pivot: $1.21 — the current price is the pivot. A daily close above $1.25 reopens the door to $1.28–$1.30. A daily close below $1.18 invites a test of $1.12.
Traders building short-term scenarios should anchor stops around these levels rather than trying to predict the exact path.
XRP Price Live: Reading the Volume Spike
The single most important real-time XRP price signal today is that 24h volume is up 38.81% to $3.14B while market cap is down 4.71%. Three possible interpretations:
- Capitulation flush — late longs giving up; historically a precursor to a bounce.
- Hedging flow — large holders rolling spot into derivatives shorts to protect inventory.
- Distribution into liquidity — strong hands handing supply to weaker hands at the lows.
The fact that the Coppock Curve is already deeply negative argues against scenario 3 being dominant. Most likely we are seeing a mix of (1) and (2): tactical hedging plus retail exit. That setup tends to produce range expansion within 1–2 weeks rather than an immediate trend continuation.
XRP Price Today vs Macro Crypto Context
XRP's 4.15% volume-to-market-cap ratio is healthy but not elevated, and the FDV of $121.84B versus a circulating market cap of $75.6B reflects the well-understood 38B-token supply overhang that any XRP price analysis has to acknowledge. Holders count of 532.64K continues to grow slowly, suggesting structural demand has not collapsed alongside price.
In the broader large-cap altcoin tape, XRP's −8% week is roughly in line with sector weakness — not a single-name capitulation. That keeps the price action squarely in the realm of technical mean reversion, rather than a fundamental re-rating. Bitcoin and Ethereum are also showing similar patterns.
How Traders Are Positioning on Phemex
For active traders watching the XRP price live, the current setup favors defined-risk positions over directional conviction:
- Phemex Spot (XRP/USDT) — for accumulators using the deep negative Coppock as a multi-month signal to dollar-cost into the $1.12–$1.22 zone.
- Phemex Perpetual Futures (XRP/USDT) — for tactical traders fading the edges of the compressed range, with leverage scaled to the volatility of $1.20-handle price action.
- Phemex Earn — for holders looking to generate yield on existing XRP rather than rotating out at a local low.
The unified USDT-margined account on Phemex makes it easy to move between spot accumulation and short-dated hedges without fragmenting capital — which matters when an asset is range-bound and volatility is compressed.
What to Watch Next
Three triggers will likely decide XRP's June trajectory:
- A daily close outside the $1.18–$1.25 band. Whichever side breaks first sets the next 2–3 week direction.
- MACD histogram flipping positive. That would confirm the current flattening is real, not a fake-out.
- Coppock Curve turning up from below −14. Historically the turn, not the absolute level, has been the actionable signal.
Until at least one of these triggers fires, treating XRP as a range asset between $1.18 and $1.28 is the simplest framework. For more on range trading, see our Grid Trading Guide.
Conclusion
The XRP price at $1.21 with a −8.11% weekly print looks weak on the surface, but the indicator stack tells a more nuanced story: short-term bearish, intermediate bearish, but long-cycle exhaustion is building. The volume surge into the lows is a flag, not a verdict. Patient traders will let the chart pick a side of the $1.18–$1.25 range before sizing aggressively.
FAQ
Q1: Why is XRP price down 8% this week? The drop is structural — lower highs since February, momentum indicators rolling over, and broader altcoin liquidity rotation. No single headline catalyst; price is following the chart, not the news.
Q2: Is XRP oversold right now? Not by standard measures — CRSI prints 55.62, which is neutral. However, the Coppock Curve at −14.72 is in deep cycle-bottom territory historically associated with longer-term accumulation zones.
Q3: What is the next key level for XRP price? Watch $1.18 on the downside and $1.25 on the upside. A daily close outside this band will likely set the direction for the next 2–3 weeks.