



- XRP trades at $1.13 after a 0.49% slip, its first red day in five sessions.
- Monday's symmetric-triangle breakout produced four straight green closes before this pause arrived.
- Ali Martinez says holding above $1.13 opens roughly 20% of upside toward $1.35.
- BraveNewCoin keeps the swing structure bearish until XRP closes a day above $1.29.
- The old triangle resistance at $1.09-1.10 is the floor this dip has to hold.
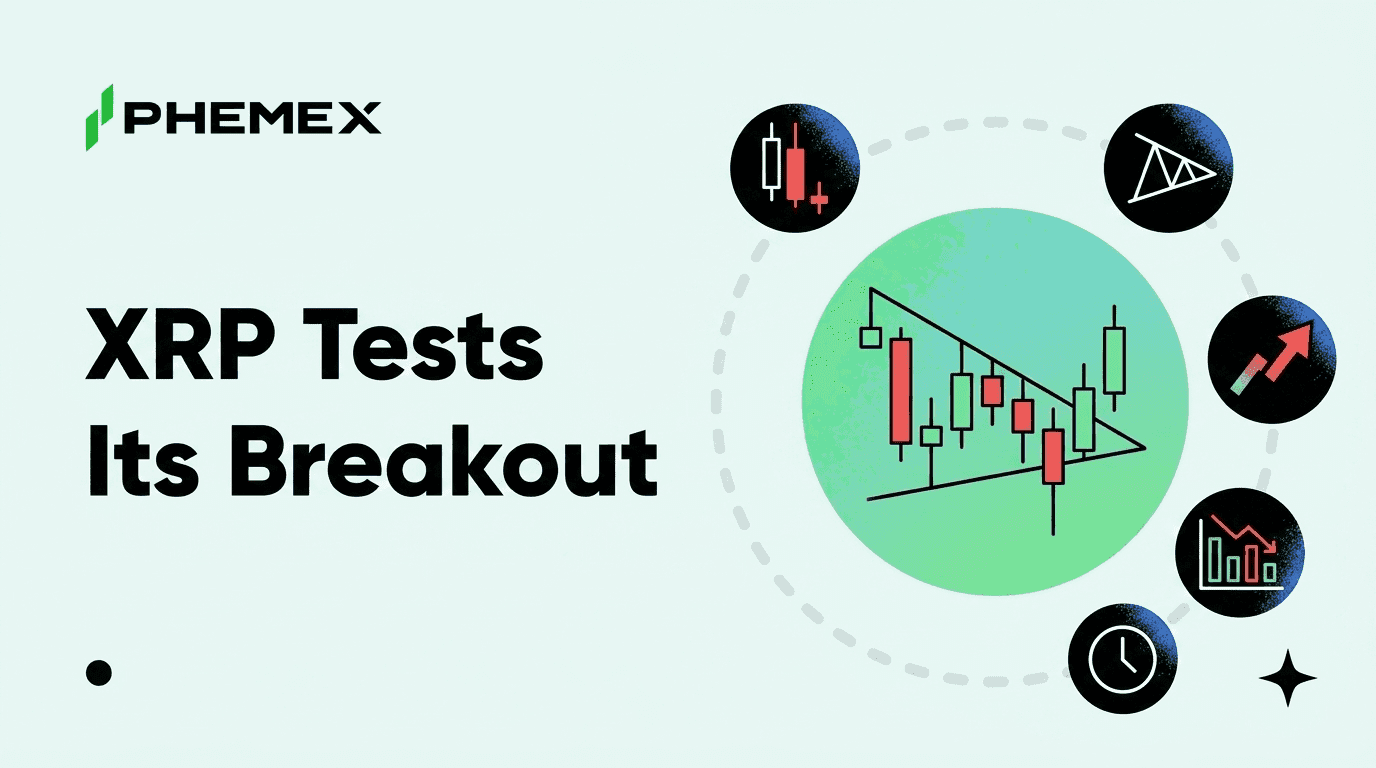
XRP slipped 0.49% to $1.13 on Thursday, July 23, 2026, its first red day after four consecutive green closes and Monday's break from a multi-week symmetric triangle. XRP is the native token of the XRP Ledger, a payments-focused blockchain whose design is documented in the XRP Ledger developer docs, and its chart is now asking the only question that matters after any breakout. Is this dip the retest that confirms the move, or the failure that cancels it?
Our July 22 breakout piece named a pullback toward the broken line as the logical next step, and that dip has now arrived on schedule. The playbook below covers what a healthy retest looks like and the seven levels that grade this one.
XRP Price Today After Four Green Closes and One Triangle Break
The four-day run that ended this morning carried XRP out of a symmetric triangle that had compressed price through most of July, with Monday's candle closing above the pattern's falling resistance line near $1.09-1.10. Three more green closes followed, and the advance stalled under $1.1866, the level BraveNewCoin's desk calls the first real hurdle overhead.
Thursday's 0.49% slip is small against that four-close advance, and on its own it changes nothing about the pattern. What it does change is the market's job description for the next few sessions. Instead of extending the rally, XRP now has to prove the breakout was real by holding the line it broke, and that test is the whole reason this red day matters more than its size suggests.
And the size is worth keeping in perspective. Half-percent pullbacks in the week after a breakout are so common that their absence would be the stranger signal, because a market that never lets anyone in below the highs is usually running on thin participation.
What a Breakout Retest Actually Tests
A breakout retest is a pullback to the level a market just broke through, where old resistance gets tested as new support. The market is re-asking the breakout question with real money on the line. When buyers defend the broken line, resistance converts into support, the pattern is confirmed, and nobody who bought the breakout is trapped. When price sinks back inside the triangle, the breakout is canceled and everyone who chased the first move is stuck holding entries above the market.
Think of the broken line as a door the market just walked through. A retest is the market leaning back on that door to check it locked behind it. If the door holds, the old room becomes the floor, and if it swings open, the whole move gets walked back.
Healthy breakouts dip for mechanical reasons. Traders who bought near the line take quick profits, shorts mount one last defense of a level they watched for weeks, and the first wave of momentum buyers runs out before new demand rotates in. Our guide to triangle patterns covers why the measured move only counts from the breakout point once the retest resolves, which is exactly why experienced traders often prefer the second entry to the first.
Volume is the tell that separates the two outcomes. A healthy retest contracts in volume on the way down, because conviction sellers are absent and the dip is being driven by profit-taking rather than distribution. The bounce should then expand in volume and usually announces itself through reversal candles at the broken line, a hammer or an engulfing close printed right where old resistance should act as support. Expanding volume into the line is the warning sign, because it means sellers are pressing the retest instead of stepping aside.
The Seven XRP Levels That Grade This Retest
Ali Martinez made the bull case in a CoinDesk piece on July 21, arguing that as long as XRP holds above $1.13, the breakout opens roughly 20% of upside toward $1.35. BraveNewCoin's structure read is more guarded, keeping the swing bearish until a daily close lands above $1.29 and noting that the daily EMAs cap price from $1.24 up to that same line. Between those two views sits a ladder every XRP trader can act on, from the upside target down to the last support shelf.
|
Level
|
Type
|
What happens there
|
|
$1.35
|
Upside target
|
Martinez's measured objective, roughly 20% above the $1.13 trigger
|
|
$1.29
|
Structure pivot
|
A daily close above it flips BraveNewCoin's swing structure from bearish to bullish
|
|
$1.24
|
EMA cap begins
|
The bottom of the daily EMA band that has capped every rally attempt
|
|
$1.1866
|
First hurdle
|
The nearest overhead resistance a bounce must clear before higher targets count
|
|
$1.13
|
Current price and trigger
|
Martinez's line in the sand, holding it keeps the 20% path open
|
|
$1.09-1.10
|
Retest floor
|
The old triangle resistance line, the zone this dip must hold to confirm the breakout
|
|
$1.02-1.06
|
Support zone
|
The demand shelf that would catch a failed retest before the structure fully breaks
|
Two rows carry most of the weight for the next week. A push through $1.1866 tells you the bounce is real and moves the conversation up to the EMA band, while a daily close below $1.09 tells you the breakout no longer exists and every level above it goes back to being resistance.
The Bearish XRP Structure Bulls Still Have to Break
BraveNewCoin's core argument deserves a fair hearing, because it has been right for months. On their read, nothing about the swing structure turns bullish until XRP prints a daily close above $1.29, and every rally since the spring has died inside the $1.24-1.29 EMA band that sits below that trigger. The triangle breakout is real, but it is a pattern inside a structure that still points down.
The interesting part is that even this cautious read argues for wanting the dip. Their desk wrote that bulls should want a retest of the $1.18-1.23 zone rather than a chase into EMA resistance, on the logic that a defended pullback builds a base while a chased rally just delivers fresh sellers to the band. The market has since overshot that script to the downside, which moves the same question down to the triangle line itself. The zone changed, but the logic behind it carries straight down to the new one.
History backs the caution. XRP spent much of 2026 punishing traders who bought strength into moving-average resistance, a habit our June 3 XRP chart breakdown documented when a promising bounce faded under the same EMA cluster. The difference this time is that XRP is approaching those averages from a confirmed pattern breakout with a defined floor beneath it, which gives the trade a structure those failed bounces never had.
XRP Funding and a Binary Macro Week
Positioning matters as much as the chart during a retest, and it is worth checking the Coinglass funding-rate boardbefore sizing anything. A retest entry behaves differently when perpetual longs are paying heavy funding, because crowded leverage turns a routine dip into a cascade of forced sellers at exactly the level that needs defending. Flat or slightly negative funding into the $1.09-1.10 zone would be the supportive reading, since it means the retest is being met by spot demand instead of leveraged hope.
The calendar adds its own risk, because the Warsh Fed's second meeting and the Senate's CLARITY push land in the same week, a collision we break down in a separate piece today. For this token specifically, the regulatory half of that week is not background noise. XRP carries direct CLARITY exposure through its escrow and ETF threads, which our escrow and CLARITY Act breakdown mapped in June, so a headline can move this chart independently of the Fed.
The practical adjustment is simple. Judge the $1.09-1.10 floor on daily closes, since event weeks print misleading intraday wicks that tag stops without changing the structure, and keep position sizes small enough that a headline-driven spike through the floor is an acceptable loss instead of a forced exit at the low.
Frequently Asked Questions
Will XRP hold $1.13?
The honest answer is that nobody knows, but the tripwires around the level are unusually clear. $1.13 is Ali Martinez's trigger for the move toward $1.35, and the old triangle line at $1.09-1.10 sits just beneath it as the breakout's last line of defense. As long as XRP keeps printing daily closes above that band, the retest is working and the upside case stays open.
What is a breakout retest?
A breakout retest is a pullback to the level a market just broke through, where old resistance gets tested as new support. Healthy retests arrive on shrinking volume and hold the broken level on a closing basis, which hands trend traders a second entry with clearly defined risk. A failed retest closes back inside the original pattern and cancels the breakout signal entirely.
Why is XRP down today?
XRP's 0.49% slip to $1.13 on July 23, 2026 reflects profit-taking after four straight green closes, with no negative headline behind the move. Pullbacks of this size are normal in the first week after a pattern breakout, and this one keeps XRP above every level that defines the bullish setup. The reading only changes if the dip extends below $1.09 on a daily close.
What happens if XRP falls below $1.09?
A daily close below $1.09 puts XRP back inside the July triangle and cancels the breakout, turning the pattern into a trap for everyone who bought the initial move. The next meaningful demand sits at $1.02-1.06, the support shelf beneath the structure. Disciplined breakout traders typically exit on that close rather than average down into a failed signal.
Bottom Line
The retest hands you a decision tree instead of a prediction. If daily closes hold $1.09-1.10, the breakout stands and dips into that floor remain buyable with a stop below the zone. If a bounce clears $1.1866, the path into the $1.24-1.29 EMA band opens, and a daily close above $1.29 flips the swing structure bullish with $1.35 as the destination that pays the whole setup. If $1.09 fails on a close, the pattern is canceled and there is no long case until $1.02-1.06 proves it can hold. XRP spent four days making the bullish argument, and this dip is where the market either confirms it or withdraws it.
This article is for informational purposes only and does not constitute financial or investment advice. Cryptocurrency trading involves substantial risk. Always conduct your own research before making trading decisions.