XRP is changing hands at $1.045 this morning, June 29, 2026, down a fractional 0.08% on the day but grinding lower with everything else in a market that has been red for weeks. Bitcoin sits at $59,658, back under the psychological $60,000 line, and the Crypto Fear and Greed Index reads 18, deep in Extreme Fear territory. This is not an XRP story so much as a whole-market story, and XRP is doing what high-beta majors do when liquidity dries up. It bleeds slowly toward support and waits for a reason to move, and the XRP futures and liquidation data reflects exactly that kind of compression.
The interesting part is what is happening underneath the price. Spot XRP ETF inflows have been one of the few green numbers on the board even while the chart falls, and the SEC just made the path for new crypto funds dramatically faster. Here is where the levels sit, what the flow data is actually saying, and the price marks that decide if XRP holds this range or loses it.
XRP Price Snapshot for June 29, 2026
- XRP price: $1.045
- 24h change: -0.08%, effectively flat on the day while the multi-week trend stays down
- Fear and Greed Index: 18 (Extreme Fear)
- Nearest support: $1.00, the round number defending the structure
- Nearest resistance: $1.08, the level bulls need to reclaim first
The snapshot tells you the setup at a glance. XRP is pinned just above a round number on a day when sentiment is as fearful as it gets, which is exactly the kind of compression that resolves with a sharp move once the broader market picks a direction. The token is not crashing in isolation. It is tracking Bitcoin lower as the whole risk complex de-grosses into quarter-end, with Q2 closing tomorrow on June 30.
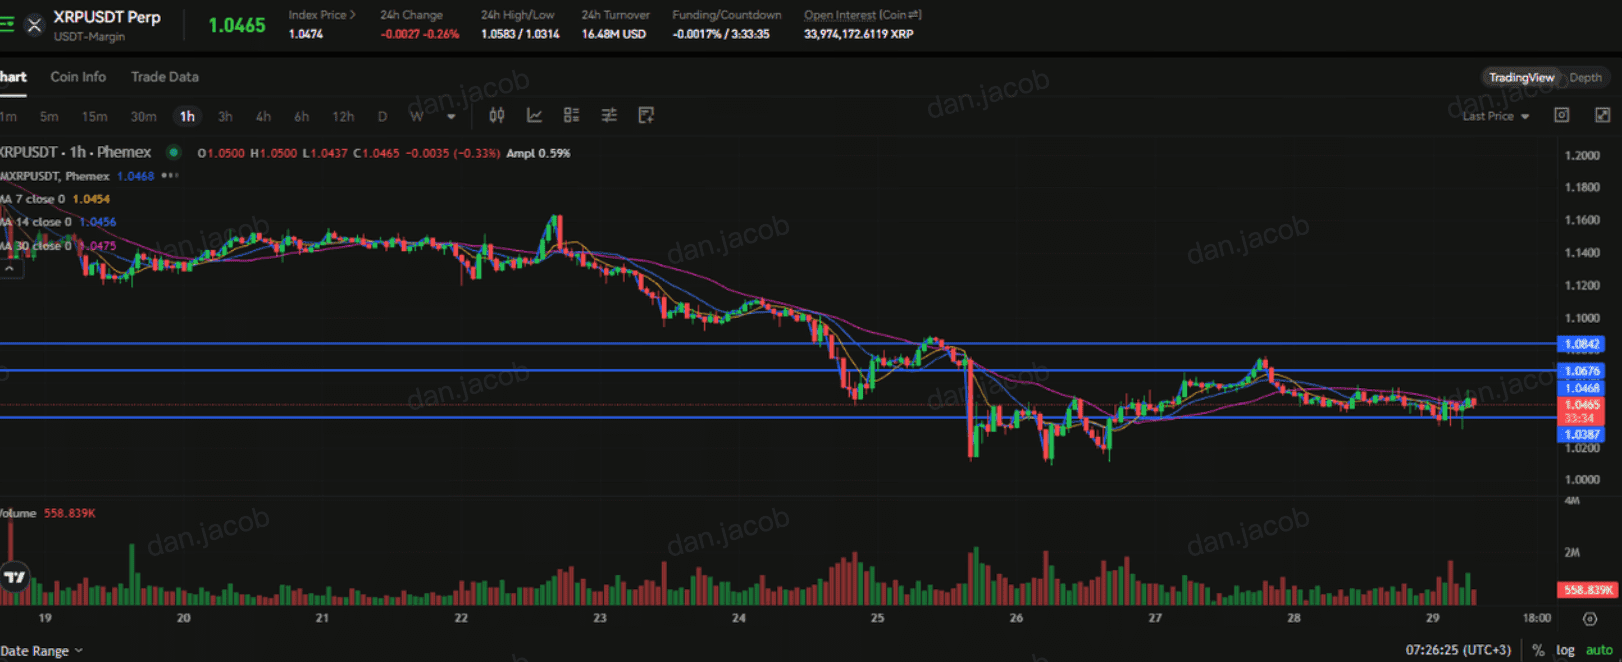
The XRP Price Levels That Decide the Next Move
Price action does the talking when sentiment is this washed out, so the levels matter more than any narrative right now. The table below maps the zones traders are watching around the current $1.045 print, from the first floor that has to hold to the ceiling that flips the short-term bias.
|
Level
|
Price
|
What it means
|
|
Resistance 2
|
$1.12
|
Reclaim flips the multi-week trend from down to sideways
|
|
Resistance 1
|
$1.08
|
First ceiling, where the last bounce stalled
|
|
Current
|
$1.045
|
Where XRP trades now, mid-range and undecided
|
|
Support 1
|
$1.00
|
Round-number floor and the line bulls must defend
|
|
Support 2
|
$0.96
|
Loss here opens air down toward the next demand shelf
|
The map is simple to read. As long as XRP holds $1.00 on a closing basis, the range stays intact and this is a slow bleed inside a base, not a breakdown. Lose $0.96 with conviction and the structure breaks lower, because there is little visible demand between there and the next shelf, and forced selling tends to accelerate once a round number cracks. On the upside, $1.08 is the first real test. The honest read is that nothing bullish confirms until XRP closes back above it, and a reclaim of $1.12 is what actually flips the short-term trend.
This is where most traders get the timing wrong. They buy the round number on the first touch because it feels like support, then get stopped out when it gives way under broad-market pressure. In a tape this weak, waiting for a reclaim is usually safer than catching the knife.
Why the Bear Market Backdrop Is Dragging XRP Down
XRP is not weak because of anything specific to Ripple. It is weak because the entire market is in a multi-week drawdown that has pushed the Fear and Greed Index to 18, a reading that historically only shows up near capitulation phases. When BTC loses $60,000 and heads for a rare back-to-back quarterly loss, correlations snap to one and high-beta majors like XRP fall harder than the index they follow.
The macro backdrop is doing XRP no favors. Risk appetite is thin, stablecoins are absorbing the capital rotating out of altcoins, and quarter-end positioning into June 30 adds a layer of mechanical selling that has nothing to do with fundamentals. None of this is XRP-specific, which is the point. A token that falls with the market on no news of its own usually recovers with the market too, and that is the bull case hiding inside an ugly chart.
There is a real difference between a token bleeding on bad news and a token bleeding on no news. XRP is firmly in the second camp right now, which is what makes the flow data worth a closer look.
The XRP ETF Flow Data Is the Bright Spot
Price has been falling, but spot XRP ETF flows have not. Inflows into the XRP funds have stayed positive on most days through this drawdown, which is unusual. When an asset is in a steep decline, the typical pattern is outflows that feed the selling. Net inflows during a price drop tell you that a slower-moving pool of capital is accumulating into weakness, treating the lower price as an entry rather than an exit.
It helps to understand how to read these numbers, because daily flow is the cleanest real-time signal of institutional demand we have. If you want the mechanics, our explainer on reading Bitcoin ETF flows covers the same logic that applies to the XRP products. The short version is that consistent net inflows during a price decline are a quiet divergence, and divergences like this often resolve in the direction of the flows once the broad-market pressure lifts.
This does not mean XRP cannot go lower. Flows are a backdrop, not a timing tool, and a few days of institutional buying does not override a market-wide deleveraging. What it does mean is that the dip is being met with real demand rather than abandoned, and that is a meaningfully better setup than the last time XRP traded down here.
The SEC ETF Fast-Track Is the Catalyst Bulls Are Waiting For
The single biggest forward catalyst for XRP is regulatory, and it just got closer. The SEC adopted new generic listing standards that cut the approval timeline for qualifying crypto ETFs from as long as 240 days down to roughly 75 days, removing the case-by-case bottleneck that held up dozens of filings. Industry analysts project that 100 or more new crypto ETFs could launch under the streamlined process, and a spot XRP product is one of the most anticipated names in that queue.
This matters for XRP specifically because of its history. XRP and Ripple spent years under the regulatory cloud of the SEC litigation, and a fast-tracked spot ETF would be the clearest possible signal that the asset has moved fully into the mainstream-product category alongside Bitcoin and Ethereum. The faster approval window means the wait is measured in months, not years.
We covered the broader regulatory and ETF setup in our XRP price analysis for June 2026, and the through-line has not changed. The catalyst is real and getting closer, but markets are forward-looking, and a fearful tape can keep XRP cheap right up until the moment the approval headline lands. That gap between a strengthening fundamental case and a falling price is the entire setup here.
What Bulls Need to Reclaim and What Breaks the Structure
Strip away the narrative and the decision comes down to two prices. Bulls need to reclaim $1.08 to argue the bleeding has stopped, and a close above $1.12 to claim the short-term trend has actually flipped. Until one of those happens, every bounce is a bounce inside a downtrend and should be treated as one, not as the bottom.
On the other side, $1.00 is the line that keeps the range alive and $0.96 is the line that ends it. A daily close below $0.96, especially on rising volume, breaks the structure and opens the door to a faster move lower. The cleanest way to trade this is to let the level confirm first. Buying the reclaim of resistance or the defense of support is a higher-probability play than guessing the exact bottom in a market printing a Fear reading of 18.
Frequently Asked Questions
What is the XRP price today?
XRP is trading at $1.045 as of June 29, 2026, down a fractional 0.08% on the day. The token is grinding lower alongside the broader market, with Bitcoin under $60,000 and the Fear and Greed Index at 18.
Will XRP go up in 2026?
The forward case rests on the spot XRP ETF, which the SEC has now put on a faster approval track of roughly 75 days. ETF inflows have stayed positive even as price falls, which is constructive, but XRP will likely stay tied to the broad market until sentiment turns.
What are the key support levels for XRP right now?
The first floor is $1.00, the round number that has to hold to keep the range intact. Below that, $0.96 is the level whose loss would break the structure and open the door to a faster decline.
Why is XRP falling if ETF flows are positive?
XRP is falling because the entire market is in a multi-week drawdown, not because of anything specific to Ripple. Positive ETF flows show institutions accumulating into weakness, but a few days of inflows cannot offset a market-wide deleveraging into quarter-end.
Bottom Line
XRP at $1.045 is a range trade until it is not, and the levels do the deciding. Hold $1.00 and this stays a slow bleed inside a base while the spot ETF catalyst builds. Reclaim $1.08, then $1.12, and the short-term trend flips from down to sideways. Lose $0.96 on a daily close and the structure breaks, with little support visible underneath. The flow data and the SEC fast-track both argue the fundamental case is strengthening even as the chart falls, but in a tape printing Fear at 18, the smart move is to let the level confirm before committing rather than catching the knife at a round number.
This article is for informational purposes only and does not constitute financial or investment advice. Cryptocurrency trading involves substantial risk. Always conduct your own research before making trading decisions.