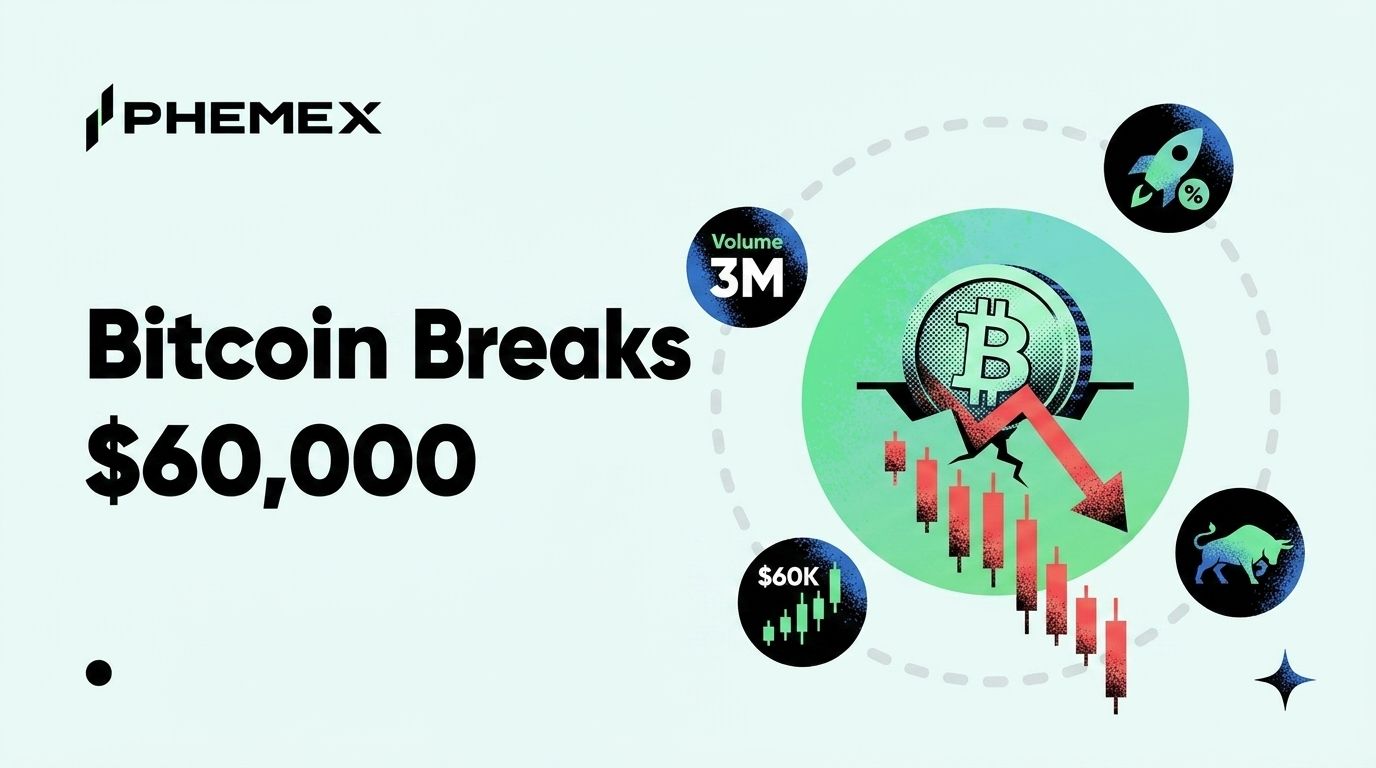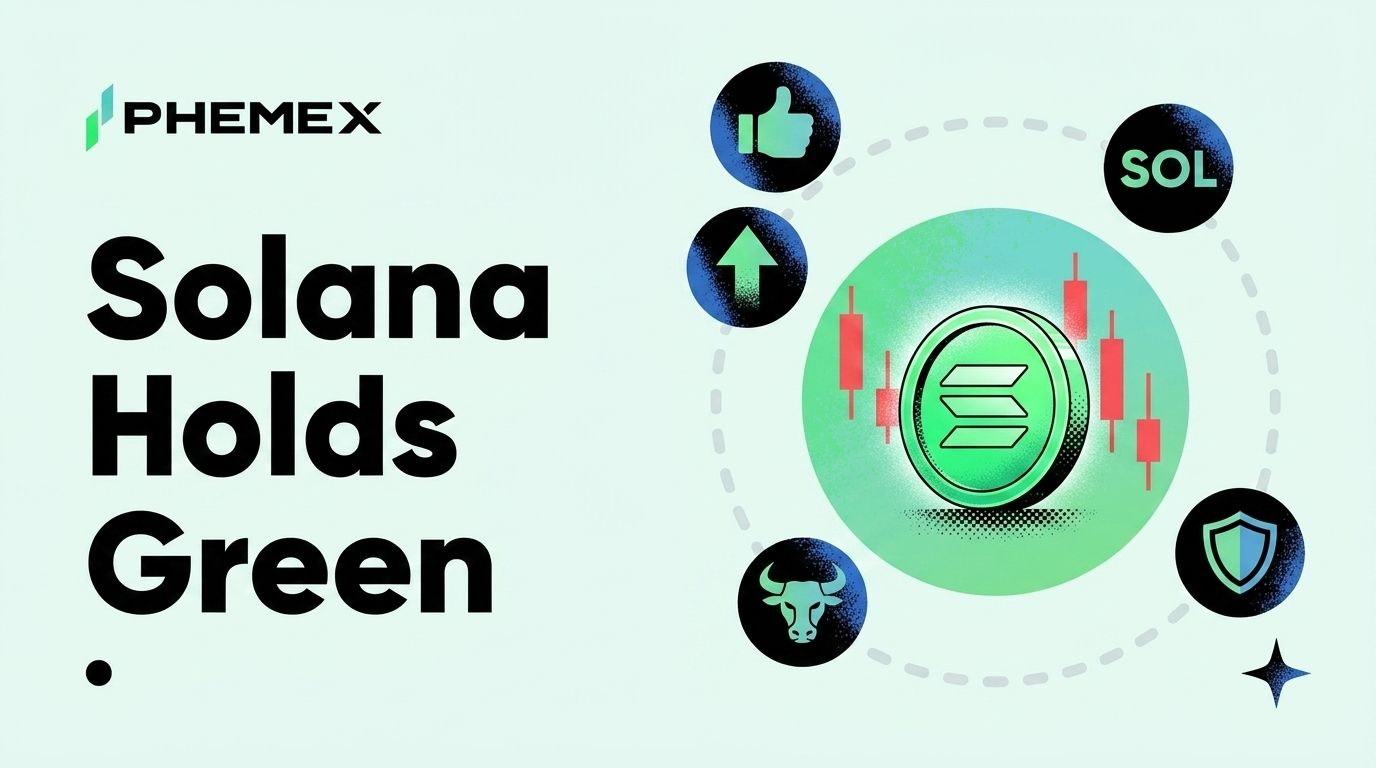
Solana is trading around $74.56, up 3.6% on the day, while almost everything else on the screen is red. Bitcoin just slipped below $60,000 to roughly $59,866, Ethereum is sitting at a multi-year low, and the broad market has burned through close to $1 billion in liquidations over the past 24 hours. The Fear and Greed Index reads 18, deep in extreme fear, and it is quarter-end, June 30, the day desks square books and cut risk. On a tape like that, a major closing green is the exception, not the rule.
SOL Snapshot (June 30, 2026)
Price: ~$74.56
24h: +3.6%
7d: down on the week, still inside the broader downtrend
Key support: ~$70
Key resistance: ~$80 to $85
That is what makes today worth a closer look. A single green candle inside a multi-week downtrend is not a bottom call, and anyone telling you SOL has decoupled is getting ahead of the data. But relative strength is real information. When one asset refuses to bleed while its peers get marked down, the flows behind it are telling you something. Here is what is actually holding SOL up, the levels that decide if it sticks, and how to read this kind of one-day outperformance without fooling yourself.
What Relative Strength Actually Means on a Red Day
Relative strength is simple to define and easy to misread. It means an asset is falling less than the market, or in today's case rising while the market falls. It does not mean the asset is "safe," and it does not mean the downtrend is over. It means capital is rotating toward it faster than capital is leaving it.
On a normal day, a 3.6% move in Solana barely registers as a headline. Today it stands out because of the company it keeps. Bitcoin under $60,000 marks one of its worst closes of the cycle, Ethereum is printing levels traders have not seen in years, and the liquidation cascade has been mechanical rather than news-driven. Quarter-end de-grossing forces funds to trim exposure regardless of conviction, and that selling hits the highest-beta names hardest.
SOL is a high-beta asset. It usually falls harder than Bitcoin in a flush, not softer. So when it diverges to the upside on a day built for forced selling, the question is not "why is SOL going up." The question is where the bid is coming from, and if it survives once quarter-end rebalancing clears.
What Is Driving Solana's Resilience Today
Three flows are doing the work, and none of them are sentiment.
On-chain activity has not slowed with price. Solana still processes the bulk of retail-facing on-chain volume in crypto, and that has not changed on a red day. DEX turnover, memecoin churn, and the steady flow through Solana DeFi protocols keep generating real fee demand for blockspace. You can watch this live on the DefiLlama Solana dashboard, where DEX volume and TVL track independently of the SOL spot price. When activity holds while price falls, the network is being used regardless of where the token trades, and that is the cleanest form of demand floor a Layer-1 can have.
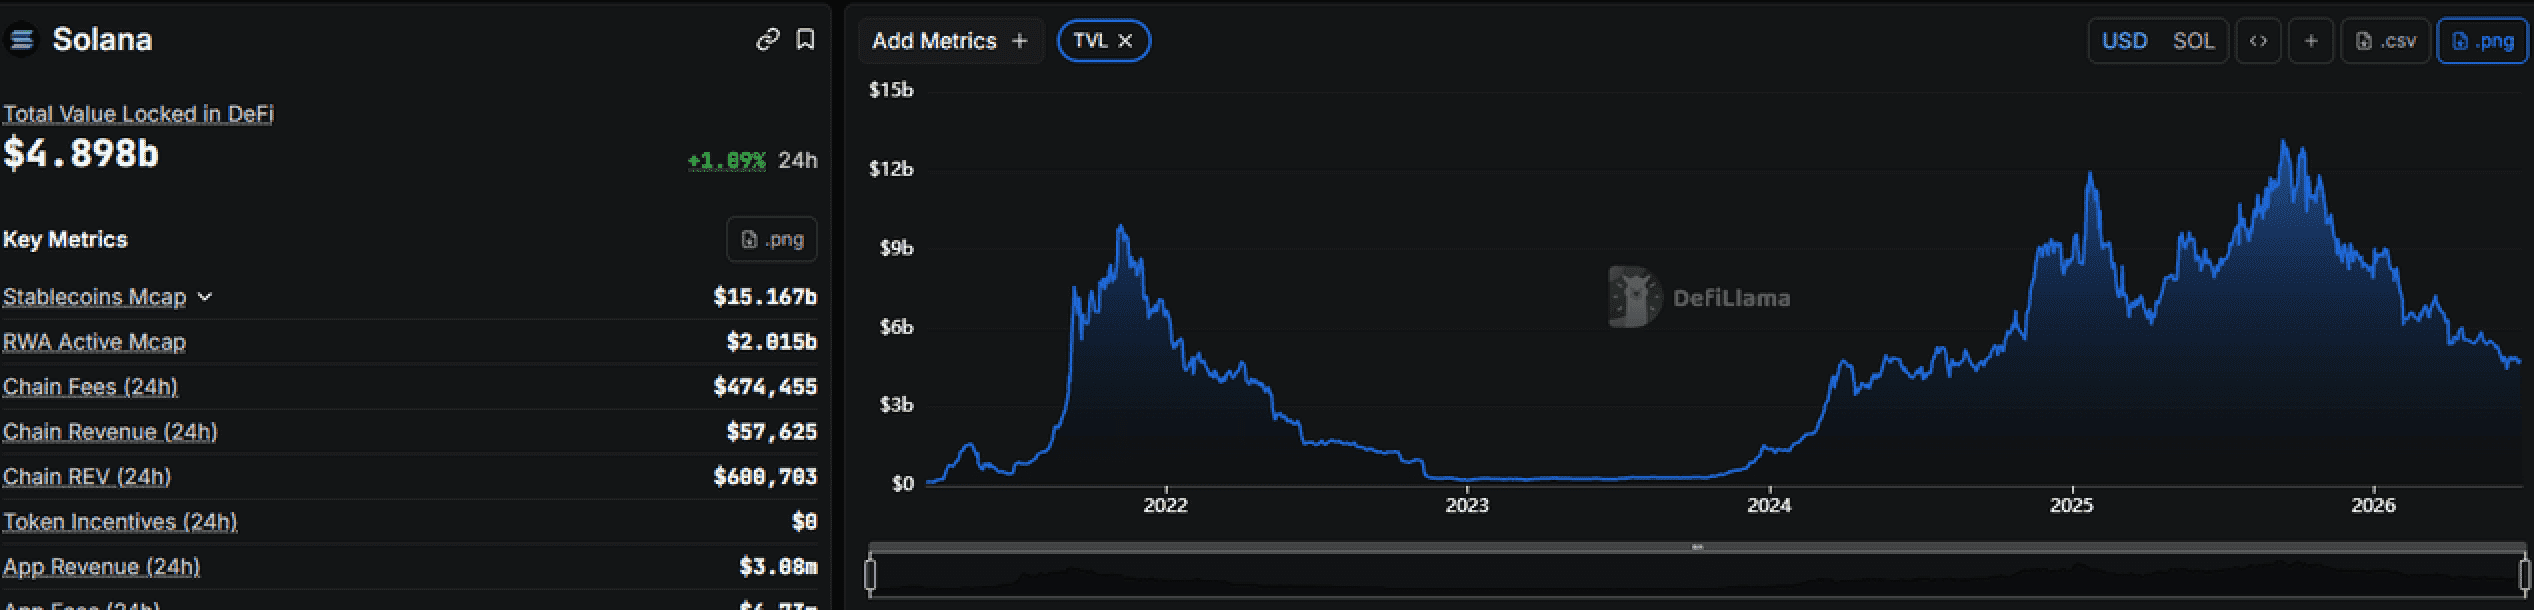
Source: DefiLlama
Solana ETF flows have held up better than Bitcoin's. The spot-BTC-ETF complex has been bleeding for seven straight weeks, and that persistent outflow is a direct driver of Bitcoin's slide under $60,000. Solana's newer ETF products have not seen the same scale of redemptions, which means the marginal institutional seller in SOL is quieter right now than the marginal seller in BTC. If you track this kind of data, the Farside ETF flow tables break it out fund by fund. Less forced ETF supply on a day of broad selling is exactly the kind of imbalance that produces a green candle in one asset while the rest of the board is red.
Ecosystem momentum gives SOL a story that does not depend on macro. Bitcoin's narrative today is entirely macro and flow-driven, which is why it tracks the de-risking tape so tightly. Solana has its own catalysts that trade on their own clock, from new app launches to the ongoing memecoin and DEX cycle. That partial independence from the macro story is why SOL can hold green while Bitcoin slips. It is not immune to a market-wide flush, but it is not purely a macro proxy either.
The Levels That Decide If This Holds
Numbers matter more than narrative here, so frame the move with the levels that count rather than the green percentage.
SOL is holding above $70, which is the line that matters most on the downside. That zone has acted as the floor through the recent chop, and it is where dip buyers have repeatedly stepped in. As long as $70 holds on a closing basis, today's strength is structurally intact and the bias stays "buy the dip toward support." Lose $70 with conviction, and the relative-strength story flips fast, because a high-beta name breaking support in a fearful market tends to accelerate rather than drift.
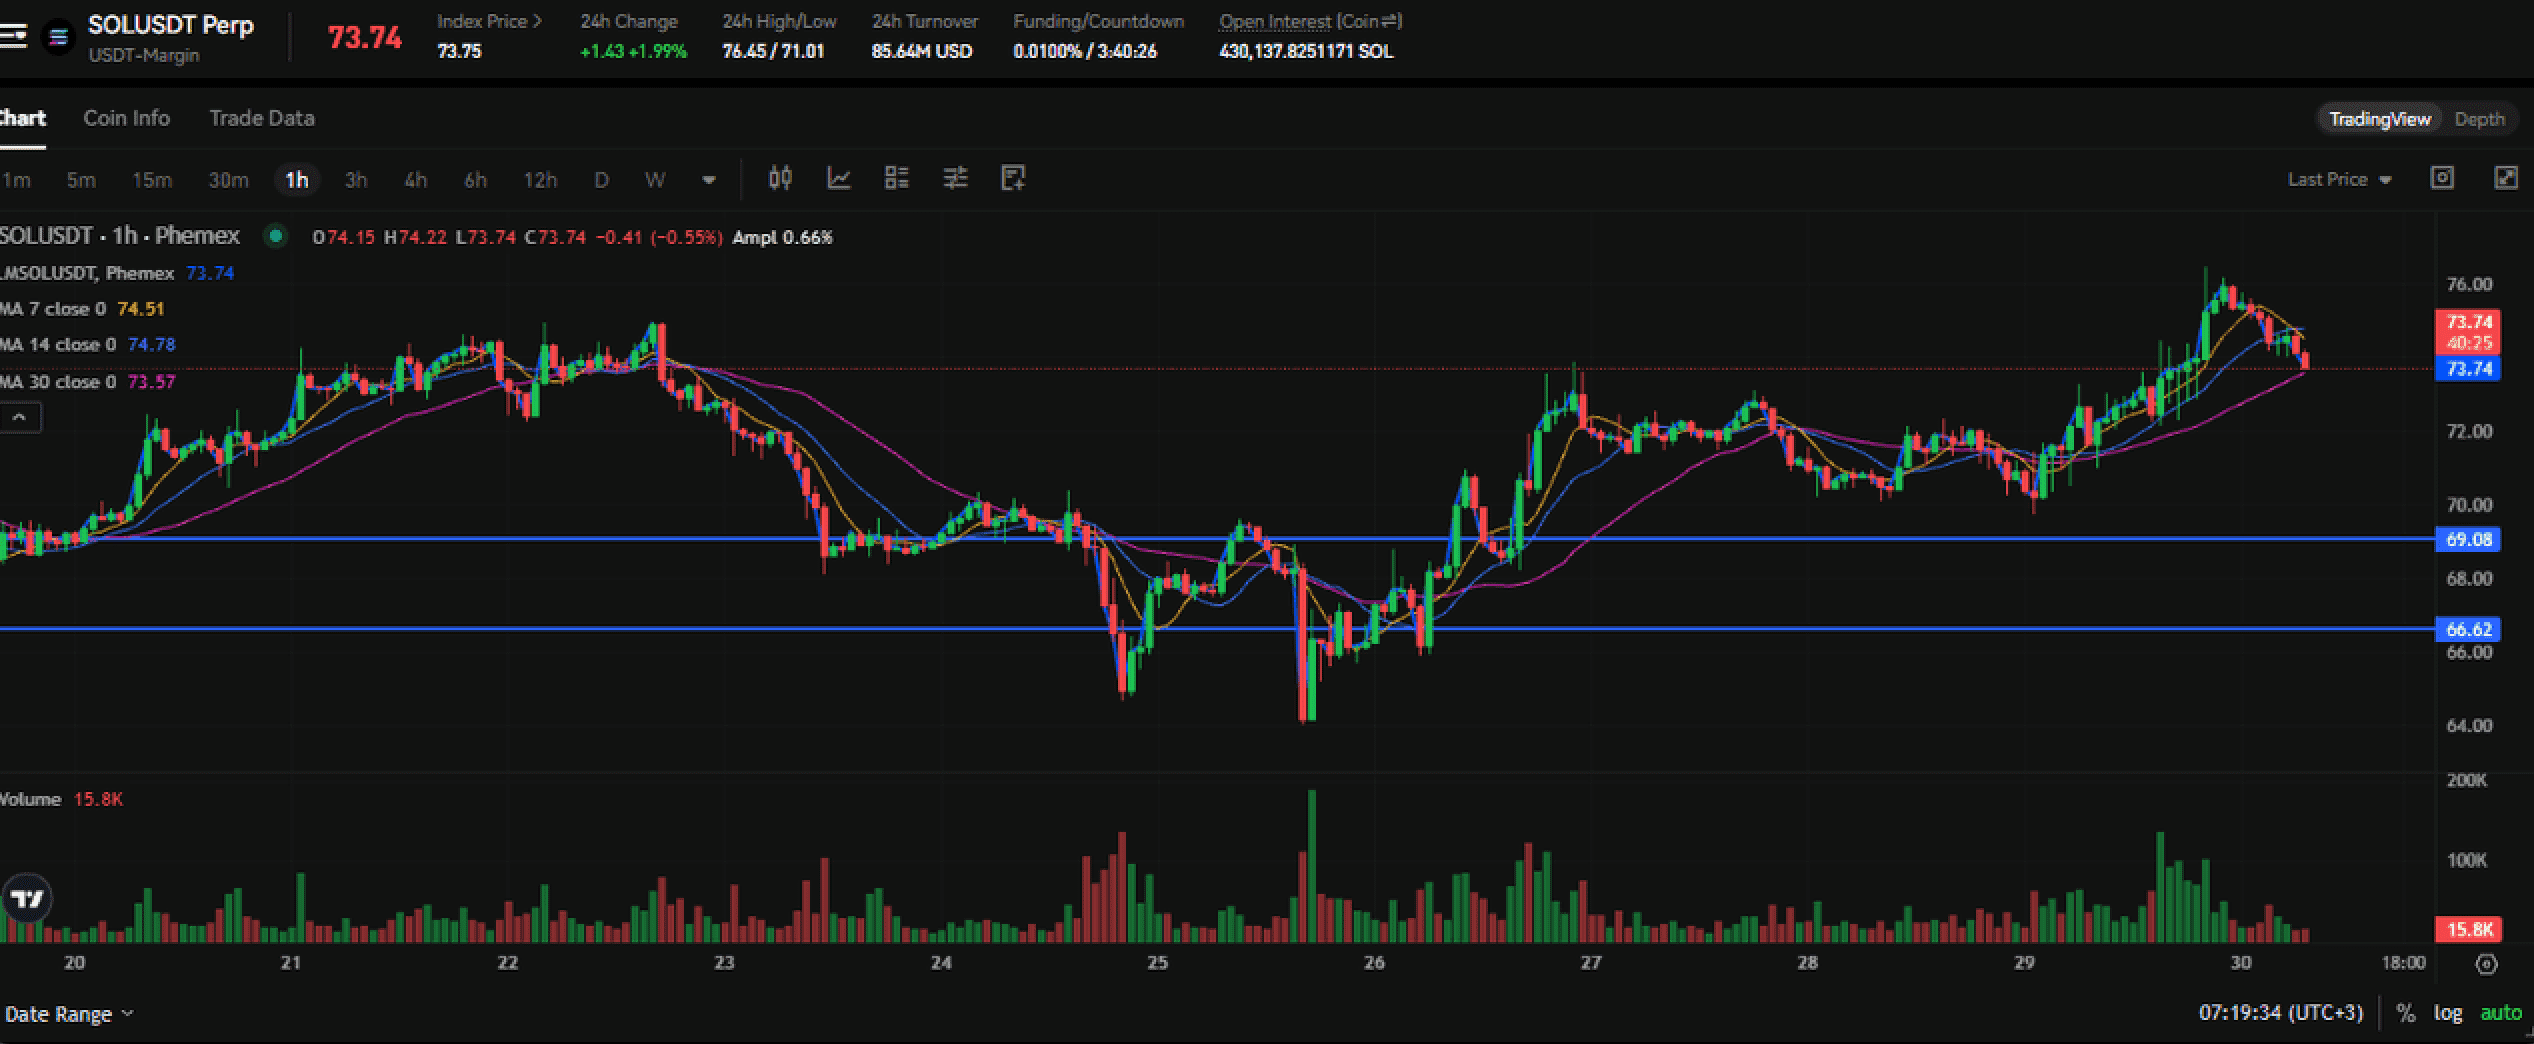
On the upside, $80 to $85 is the resistance band that caps the move. That is the supply zone SOL has been rejected from before, and it is where short-term sellers wait. A 3.6% day that stalls into $80 is relative strength inside a range. A daily close back above $85 would be the first real evidence that today is more than a one-session divergence.
|
Level
|
Price zone
|
What it means for the trade
|
|
Key support
|
~$70
|
Floor. Holds = dip-buy bias intact. Loses = relative strength flips
|
|
Current price
|
~$74.56 (+3.6%)
|
Mid-range. Green, but inside the established band
|
|
First resistance
|
~$80
|
Short-term sellers. A stall here keeps it range-bound
|
|
Range top
|
~$80 to $85
|
Reclaim on a daily close = divergence becomes a trend signal
|
|
Macro backdrop
|
BTC <$60K, F&G 18
|
Broad fear. SOL strength is relative, not confirmed reversal
|
The honest read is that SOL is trading in the upper-middle of a range it has not broken out of. Green on the day yes, but decoupled from the broad market no.
Does Single-Day Outperformance Tend to Hold or Fade
This is the part most traders get wrong, so be careful with it. One green day in a broad sell-off has two very different historical outcomes, and which one you get depends on what the rest of the market does next.
When relative strength holds, it usually shows up first. The names that fall least during the flush are frequently the names that lead the bounce when the market turns, because the capital that stayed through the drawdown is already positioned. If Bitcoin stabilizes above its lows and the liquidation pressure clears, SOL's early strength becomes a tell that it leads the recovery leg.
When relative strength fades, it fades violently. A high-beta asset that holds up while the market drops can snap down hard if the broad sell-off has a second wave, because the de-grossing simply had not reached it yet. Quarter-end is exactly the kind of mechanical event that can produce a delayed flush. The green candle today does not protect SOL from a Bitcoin breakdown tomorrow.
So the answer is conditional, not directional. Single-day outperformance during a sell-off is a meaningful signal about where capital wants to go, but it only converts into a durable trend if the broad market stops falling. On its own, inside a downtrend that has not bottomed, it is relative strength and nothing more. Track Bitcoin and the Fear and Greed readingalongside SOL, because SOL's follow-through is downstream of how long the macro bleed continues.
How to Trade Relative Strength Without Getting Trapped
The setup is attractive and that is exactly why it is dangerous. A green asset in a red market pulls in momentum buyers right at the point of maximum macro risk.
Size for the backdrop, not the candle. Fear and Greed at 18 with a billion in liquidations is a high-volatility regime, and that is when oversized futures positions get liquidated on a wick. The level discipline does the heavy lifting here. Long ideas only make sense while SOL holds $70, and they invalidate cleanly if that floor breaks. Chasing into the $80 to $85 resistance on a strong day is how traders buy the top of a range and then get shaken out when it rejects.
The patient version of this trade waits for two confirmations. First, Bitcoin needs to stop making new lows, because SOL cannot sustain a divergence forever if the largest asset keeps bleeding. Second, SOL needs to reclaim $85 on a daily close to turn today's relative strength into an actual breakout. Until both happen, this is a range trade with a tight invalidation, not a reversal.
Frequently Asked Questions
Why is Solana up while Bitcoin is down today?
Solana is benefiting from on-chain activity that has not slowed with price, steadier ETF flows than Bitcoin, and ecosystem catalysts that trade on their own clock rather than the macro tape. Bitcoin's slide under $60,000 is driven largely by seven weeks of spot-ETF outflows and quarter-end de-risking, pressure that has hit SOL less hard so far.
Is Solana decoupling from Bitcoin?
No, and that framing is premature on the basis of a single session. SOL is showing relative strength on one red day, but it remains a high-beta asset that usually falls harder than Bitcoin in a flush. A daily close back above $85 with Bitcoin stabilizing would be the first real evidence of independence, and today does not clear that bar.
What are the key Solana support and resistance levels right now?
The line that matters is roughly $70 on the downside, the floor where dip buyers have repeatedly stepped in. Resistance sits at $80 to $85, the supply band SOL has been rejected from before. Holding $70 keeps the structure intact, while reclaiming $85 on a close would turn today's strength into a trend signal.
Does a green day in a sell-off mean the bottom is in?
Not on its own. One day of outperformance inside a multi-week downtrend is relative strength, not a confirmed reversal, and high-beta names that hold up early can snap down hard if the sell-off has a second wave. The signal only becomes durable if the broad market stops falling.
Bottom Line
SOL holding green at $74.56 while Bitcoin slips under $60,000 is genuine relative strength, driven by on-chain demand that has not faded, calmer ETF flows, and ecosystem catalysts that do not depend on the macro story. None of that makes it a confirmed bottom, but the rules from here are clean enough to trade. If SOL holds $70 and Bitcoin stops printing new lows, today's strength is the early tell that SOL leads the next recovery leg. If SOL reclaims $85 on a daily close, the divergence becomes a trend worth trading. If $70 breaks while the market is this fearful, the relative-strength story flips and the high beta works against you fast. The green candle tells you where capital wants to go. The macro tape still decides if it gets there.
This article is for informational purposes only and does not constitute financial or investment advice. Cryptocurrency trading involves substantial risk. Always conduct your own research before making trading decisions.