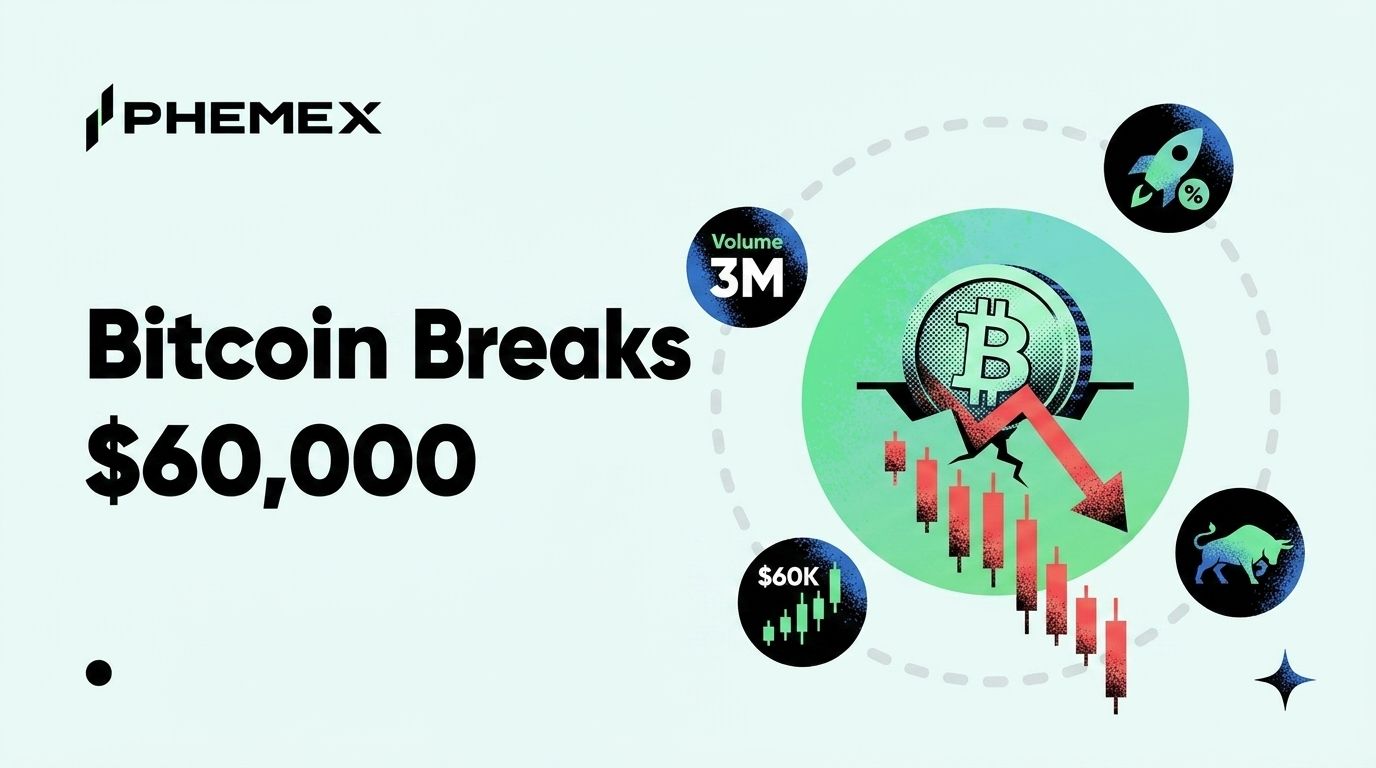
Bitcoin traded near $59,866 this morning, June 30, 2026, slipping below the $60,000 line for the first time since 2024 as the second quarter closes today. That print sits roughly 50% below the $126,000 all-time high set in October 2025, and it landed after a 24-hour stretch that wiped out close to $1 billion in leveraged positions across the market. The Crypto Fear and Greed Index sank to 18, deep in extreme-fear territory.
None of this happened on a single headline. The break below $60K is the product of several pressures stacking on the same day, and quarter-end is amplifying every one of them. Here is what pushed price through the floor and where the next lines of defense sit heading into July.
Price: ~$59,866 (below $60,000)
24h: down roughly 6%, ~$1B liquidated
7d: lower across the week on seven straight weeks of ETF outflows
Fear and Greed: 18 (extreme fear)
Key support: ~$58,000, then ~$50,000
Several of those catalysts feed each other, so the order they hit matters. Here is the chain of events behind the move.
Why Bitcoin Fell Below $60,000 Today
The single biggest mechanical force today is the calendar. June 30 is the final day of Q2, and quarter-end forces funds, market makers, and treasuries to de-gross their books for reporting. Positions that looked fine at $64,000 get trimmed regardless of conviction, and that selling clusters into the last session of the quarter. When it arrives on top of a market already leaning short, you get an air pocket rather than an orderly slide.
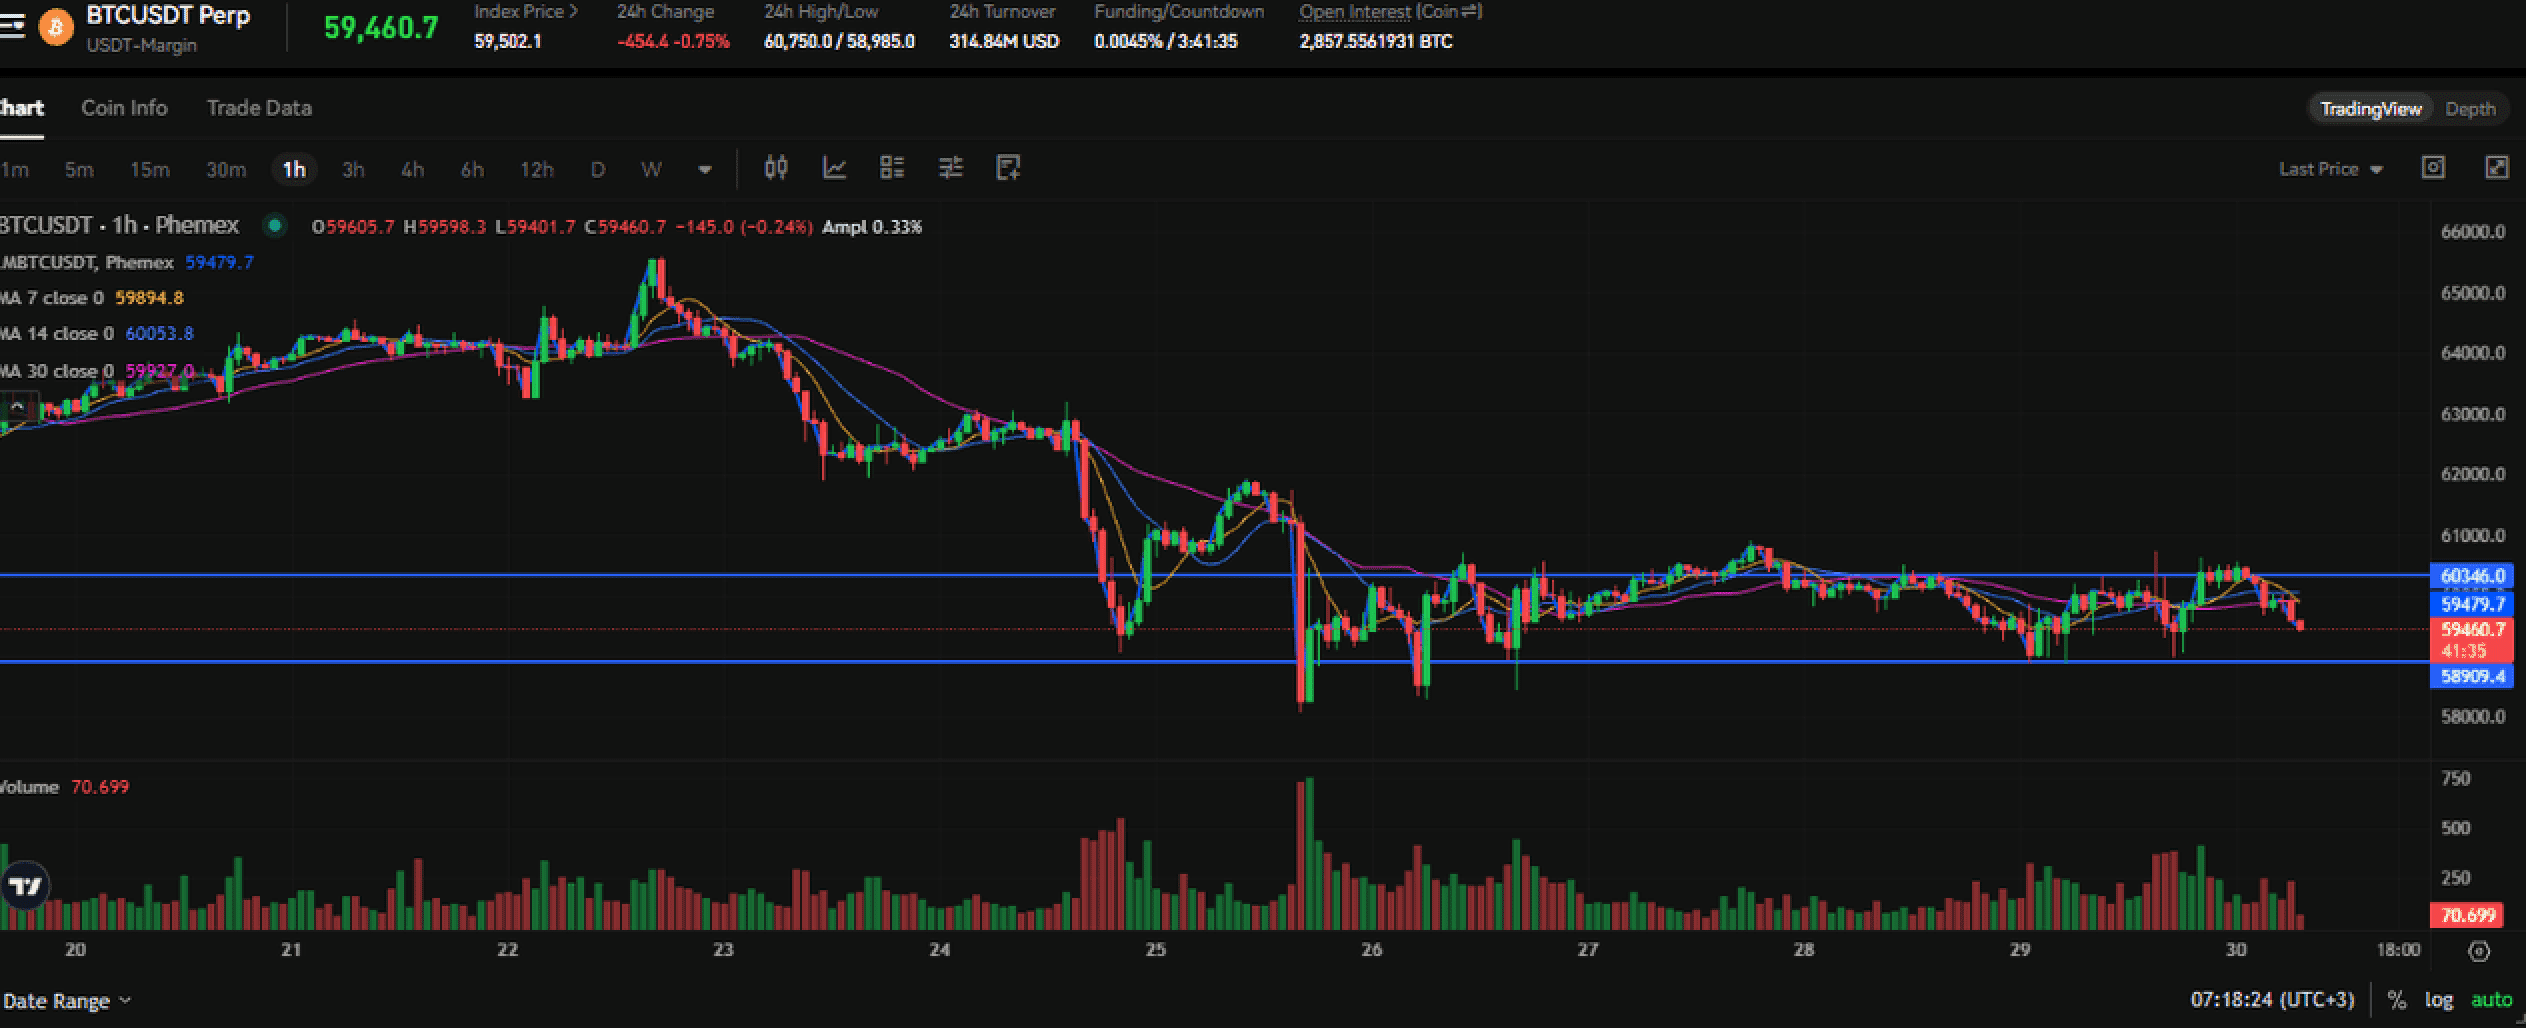
This is not discretionary selling driven by a changed thesis. Risk desks reduce gross exposure into reporting dates to show cleaner balance sheets, and that mechanical flow is indifferent to price levels or support lines. It hits whatever liquidity is available, and at quarter-end on a holiday-thinned tape, that liquidity is shallow. The result is outsized moves on relatively modest volume, which is exactly the footprint today's tape is showing.
Spot demand has been missing for weeks. The US spot Bitcoin ETFs just logged their seventh straight negative week, and the 24-hour outflow accelerated to roughly $469 million, one of the heaviest single-day redemptions of the cycle so far. You can track the running totals on the Farside ETF flow dashboard, which makes the streak visible at a glance. That product was the marginal buyer that lifted Bitcoin to its highs through 2025. With it now a net seller week after week, the bid that quietly absorbed earlier dips simply is not showing up, and price has to fall until someone else steps in to clear the supply.
The selling met thin liquidity and cascaded. Around $1 billion in positions were force-closed over 24 hours according to CoinGlass liquidation data, and the split tells the story. Roughly $780 million of that was longs against only $212 million in shorts, with Bitcoin liquidations alone near $413 million. Each liquidated long sells into the market, which pushes price into the next cluster of stops, which triggers more selling. That feedback loop is why a 6% day feels like a 12% day on the screen.
The Catalysts Stacking On Quarter-End
Quarter-end de-grossing set the stage, but three supply and sentiment shocks turned a soft tape into a flush. No single one of them breaks $60,000 on its own, yet arriving together on the same session they overwhelmed what little bid was left.
MicroStrategy disclosed its first Bitcoin sale. The company that built its entire identity on never selling reportedly trimmed part of its stack for the first time, and the symbolism hit harder than the size of the transaction itself. For years the corporate-treasury playbook was a one-way bid that other public companies copied. A disclosed sale tells the market that even the most committed holder will manage a balance sheet when price and rates move against it, and that recalibrates how traders price the entire treasury cohort.
A large estate wallet moved $739 million in coins. An address tied to the long-running Mt. Gox estate transferred roughly 10,422 BTC, worth about $739 million, and on-chain trackers flagged the movement within minutes. Estate distributions have spooked this market for years because creditors who waited a decade to be repaid are presumed sellers the moment they regain access. The transfer does not confirm a sale, but in a fragile tape running thin on liquidity, the mere possibility of that supply hitting the market is enough to pull bids lower.
The macro backdrop turned hostile at the worst time. Inflation data has stayed sticky enough that the Fed's path to rate cuts keeps getting pushed further out, and the US dollar has strengthened in response. A firmer dollar and higher-for-longer rates raise the opportunity cost of holding a non-yielding asset, and Bitcoin trades like the highest-beta expression of that exact macro view. When liquidity expectations tighten, the riskiest assets on the curve are always first to feel the squeeze, and crypto sits at the far end of that curve.
How Far Bitcoin Has Fallen From the Top
The headline number is the drawdown. From the $126,000 peak in October 2025 to today's print near $59,866, Bitcoinhas shed roughly half its value in eight months. Drawdowns of this size are not new for this asset, which has survived multiple 50%-plus corrections in past cycles and recovered to new highs each time. Each one feels terminal while it is happening, though, and that is exactly when sentiment readings like the 18 on the Fear and Greed Index get most useful as a contrarian gauge rather than a reason to panic.
Context matters more than the raw percentage. The table below frames where price sits against the levels traders are actually watching.
|
Level
|
Price
|
What it represents
|
|
All-time high
|
~$126,000
|
October 2025 cycle top
|
|
Reclaim level
|
~$64,000
|
Bulls need this back to neutralize the break
|
|
Current price
|
~$59,866
|
Below $60K, lowest since 2024
|
|
First support
|
~$58,000
|
Near-term line of defense
|
|
Deeper downside
|
~$50,000
|
Where larger structural buyers are expected
|
The structure is straightforward to read. As long as Bitcoin trades below the $64,000 reclaim level, the path of least resistance points lower, and a clean loss of $58,000 opens the door toward the psychological $50,000 zone. Tools like the 200-week moving average and broader cycle-peak indicators are worth pulling up here, because they frame the question every holder is asking right now. Is this a mid-cycle shakeout, or the start of something deeper that lasts into next year.
What to Watch Into July
The flush is mechanical, which means it can reverse just as fast once the forced selling clears. The first thing to track is the calendar itself, because de-grossing is a quarter-end event and July 1 removes that specific source of supply. A market that stabilizes tomorrow tells you a chunk of today's move was structural rather than a verdict on Bitcoin's fundamentals.
Flows are the second tell. The seven-week ETF outflow streak has to break before any rally has staying power. One green flow day is noise. A week of net inflows would confirm the marginal buyer is back, and that is the signal that historically precedes a durable low far more reliably than price alone.
The estate coins are the third tell to track closely. If that block of 10,422 BTC sits in a fresh wallet without ever hitting an exchange, the sale thesis weakens and the overhang fades from the conversation. Funding rates flipping deeply negative would round out the picture, because washed-out leverage and over-pessimistic positioning are the raw material every relief rally is built from. The setups that produce durable lows almost always pair maximum fear with confirmation, not one without the other.
Frequently Asked Questions
Why is Bitcoin falling in June 2026?
The drop below $60,000 stacks several pressures on one day. Quarter-end forces institutions to trim positions, spot ETFs are in their seventh straight week of outflows, MicroStrategy disclosed its first ever sale, and a large Mt. Gox wallet moved roughly $739 million in BTC. Sticky inflation and a stronger dollar tie it together by pushing Fed rate cuts further out.
Is Bitcoin going to drop below $50,000?
It is possible if the $58,000 support gives way, since the next major structural buying zone sits near $50,000. Nothing guarantees it, and a break in the ETF outflow streak or quarter-end pressure clearing could stabilize price well above that level. Treat $58,000 as the line that decides which scenario plays out.
What does the large estate wallet transfer mean for the price?
The Mt. Gox estate moved about 10,422 BTC, and the market reads creditor distributions as potential selling pressure because those holders waited years to be made whole. A transfer alone is not a sale, so the real signal is the destination of those coins once they settle. If they stay parked in a new cold wallet rather than moving to an exchange, the overhang on price fades quickly.
Should I buy Bitcoin during extreme fear?
A Fear and Greed reading of 18 has historically marked zones where sentiment is washed out, which contrarians watch for. It is a gauge of crowd emotion, not a timing tool, so it works best paired with confirmation like stabilizing ETF flows or negative funding. Buying purely because fear is high without a level or a catalyst is how traders catch falling knives.
Bottom Line
Bitcoin below $60,000 on the last day of Q2 is a forced-selling event layered on a genuine demand problem, and those are two different timelines. The quarter-end de-grossing should clear by July 1, but the seven-week ETF outflow streak is the real overhang and it has to break before any bounce holds. Watch $58,000 as the pivot. Hold it with ETF flows turning green and funding flushed negative, and a tradeable low is forming near here. Lose it on heavy volume, and $50,000 becomes the next conversation rather than a tail risk.
This article is for informational purposes only and does not constitute financial or investment advice. Cryptocurrency trading involves substantial risk. Always conduct your own research before making trading decisions.