Bitcoin is trading at $59,658 with two days left in the second quarter, and barring a sharp rally before the close on June 30, 2026, it is on track for something it has only done a handful of times in its history. Two negative quarters in a row. The Fear & Greed Index sits at 18, deep in Extreme Fear, and the multi-week slide that pulled price under $60,000shows up across every input that matters right now. Spot ETF outflows, long-term holders trimming size, and capital rotating into AI equities have all stacked into the same quarter-end window.
- BTC price: $59,658, holding below the $60,000 psychological line
- Fear & Greed Index: 18 (Extreme Fear)
- Quarter status: Q2 2026 closes June 30, on track for a second straight negative quarter
- Nearest support: $58,000, with $56,000 as the deeper line
- Nearest resistance: $62,000, with $64,000 as the reclaim level
A back-to-back quarterly loss is not the end of a cycle by itself, but it is rare enough that it changes how the next few weeks should be traded. The question is not if the quarter looks ugly. It does. The question is what the chart and the history actually say happens after BTC closes two quarters red. Here is what the pattern means, the levels that decide the next move, and the conditions that would flip the trend in Q3.
What a Back-to-Back Quarterly Loss Actually Means
A quarterly loss simply means Bitcoin closes a three-month period lower than it opened it. One losing quarter is common and happens in most years, even strong ones. Two in a row is the part that gets attention, because Bitcoin's long-term uptrend has historically repaired itself fast enough that consecutive red quarters are the exception rather than the rule.
Since 2013, BTC has strung together back-to-back negative quarters only a few times, and almost all of those clusters sat inside the heart of a bear market. The 2014-2015 grind, the late-2018 capitulation, and the 2022 unwind are the textbook cases. Each one featured the same emotional signature traders are staring at today. Deep fear readings, exhausted buyers, and a price that kept slipping even when the news flow looked like it should have stabilized.
The honest read is that a second red quarter is a warning, not a verdict. What followed past back-to-back losses was rarely an immediate V-shaped recovery. It was usually a stretch of basing, where price chopped sideways and rebuilt a floor before the next leg. That matters for positioning, because the trade after a double-red quarter is patience and levels, not hero longs into falling knives.
Here is how the past clusters played out.
|
Period
|
What BTC did
|
What came after
|
|
Q2-Q3 2014
|
Two red quarters into a long grind
|
Extended basing through 2015 before the 2016 recovery
|
|
Q4 2018 cluster
|
Capitulation low near the cycle bottom
|
Sharp Q2 2019 rebound once selling exhausted
|
|
Q2 2022
|
Second straight loss amid forced selling
|
Months of range-building before the 2023 recovery
|
|
Q2 2026
|
In progress, $59,658 with F&G at 18
|
Undecided, defined by the $56,000 to $64,000 range
|
The pattern across all three historical cases is consistent. The second red quarter often marked the zone where selling pressure was closest to exhaustion, but the actual bottom and the recovery did not arrive on the same candle. Traders who waited for confirmation kept their capital. Traders who tried to call the exact low usually paid for it.
The Price Levels That Decide the Next Move
BTC at $59,658 sits in a clearly defined band, and the levels around it are doing real work. The $58,000 zone is the first support that traders are watching closely, because it has absorbed selling on the way down and roughly lines up with where the recent range has tried to base. Lose it on a daily close and the path opens toward $56,000, the deeper line where bids would need to show up to keep the structure intact.
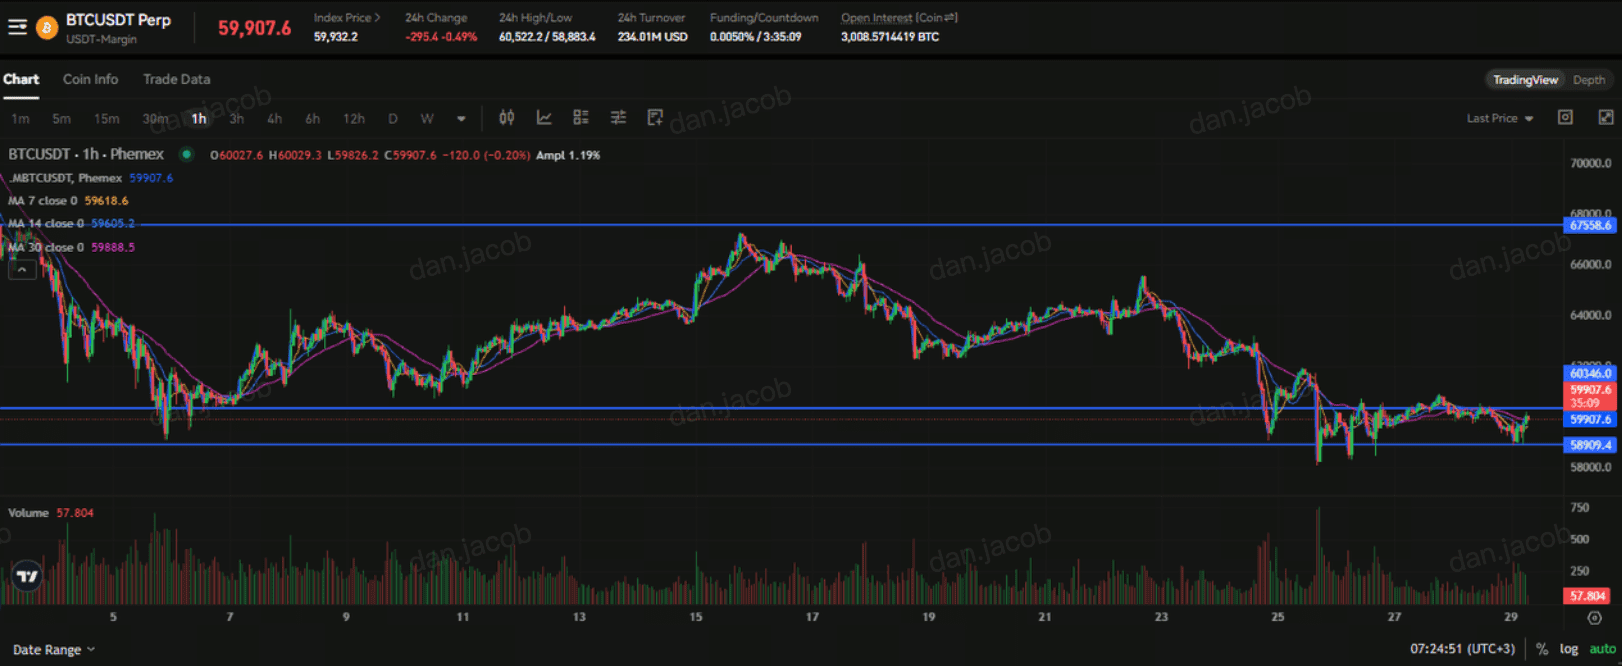
On the upside, $62,000 is the first ceiling. Reclaiming it would put the $60,000 psychological level back underneath price as support and take some of the pressure off the chart. The more meaningful level is $64,000, the resistance that has capped every bounce attempt through the back half of the quarter. Until BTC closes above it, every rally is a lower-high until proven otherwise, and the burden of proof sits with the bulls.
There is a longer-term anchor worth knowing here too. The 200-week moving average has historically marked the floor of Bitcoin bear markets, the level major bottoms have formed near in past cycles. Price has not tagged it in this move, but it frames how much room exists below current support if the selling deepens. The same goes for slower-cycle tools like the Bitcoin rainbow chart, which is built to keep traders oriented when day-to-day price action turns noisy and fear is running this hot.
The practical takeaway is narrow. As long as BTC holds the $56,000 to $58,000 shelf, the structure is a deep correction inside a larger uptrend. Lose that shelf on volume and the conversation changes to a deeper bear leg, with the longer-term moving averages as the next reference points.
Why the Final Days of the Quarter Move Differently
The last few sessions of a quarter do not always trade on fundamentals, and that is worth respecting at $59,658. Quarter-end brings window dressing, the practice where funds reshape their books before reporting periods close. In a quarter that has been red for crypto and green for AI equities, that can mean trimming Bitcoin exposure and rotating into the names that look good on a statement, which adds mechanical selling pressure that has nothing to do with Bitcoin's own outlook.
That dynamic is part of why the slide has dragged into the quarter-end rather than stabilizing. Some of the recent pressure is positioning, not conviction. Spot Bitcoin ETF flows have leaned toward redemptions during the selloff, and the daily net numbers on Farside's BTC ETF flow tracker show how that pressure built. When those outflows land in the same window as quarter-end rebalancing, the order flow compounds. The reason this matters for traders is that mechanical selling tends to be temporary. Once the calendar turns, the forced part of the flow eases.
That cuts both ways. The same window-dressing logic that can pressure price into June 30 can reverse in early July, when fresh capital deploys and the quarter-end overhang clears. It does not guarantee a bounce. It does mean the first few trading days of Q3 carry more signal than the last few days of Q2, because they show what buyers want to do once the mechanical selling is out of the way.
This is also where the Fear & Greed reading at 18 becomes useful rather than just scary. Extreme Fear has historically clustered near local lows more often than near tops, because it shows up when sellers are already most of the way through their selling. It is not a buy signal on its own. It is context that says the easy downside may already be behind the move, and the marginal seller is getting scarce.
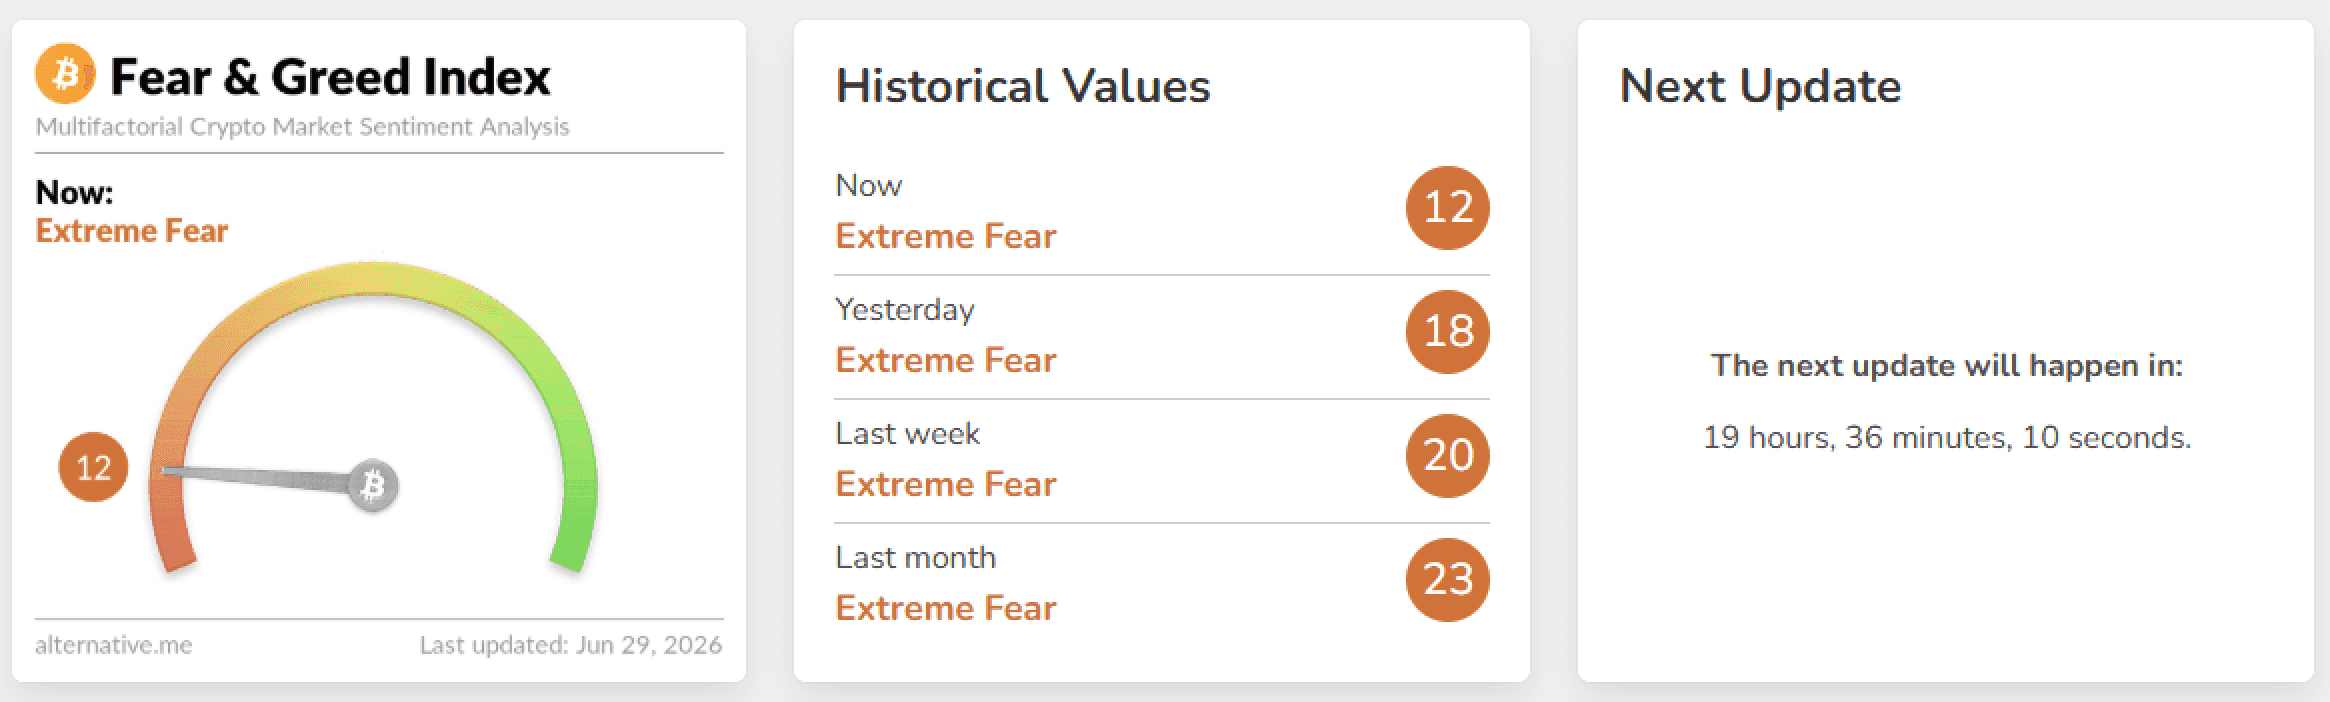
Source: Alternative.me
What Would Flip the Trend in Q3
A trend does not turn on sentiment alone, so the things to watch in Q3 are concrete. The first is the ETF flow picture. The selloff has been fed by redemptions, and the cleanest early sign of a turn is several consecutive sessions of net inflows rather than outflows. Derivatives positioning matters here too, and dashboards like CoinGlass liquidation datatrack the open interest and liquidation reads that tend to spike when a fearful move is close to flushing out the last leveraged sellers. When the largest mechanical buyers of this cycle stop selling and start adding, it removes the heaviest weight on price.
The second is the $64,000 reclaim. Sentiment can stay grim while price quietly repairs structure, and a daily close back above $64,000 would be the chart confirming what the flows might already be hinting. That flips the most recent lower-high into a higher-low setup and gives trend traders an actual line to lean on instead of guessing the bottom.
The third is the macro rotation. A meaningful part of this quarter's weakness came from capital leaving crypto for AI equities, and that rotation reverses when the relative momentum shifts or when broader risk appetite returns to digital assets. If you want to size the deviation from fair value while that plays out, slow-moving Bitcoin valuation tools are built for exactly this kind of fearful, washed-out tape, where the daily candles are too noisy to trust on their own.
None of these flips the trend instantly, and that is the point. The recovery after past back-to-back losses came in stages. Selling exhausts, price bases, flows turn, and only then does the reclaim happen. Watching those steps in order is more useful than waiting for a single headline to declare the bottom.
Frequently Asked Questions
Has Bitcoin ever had two losing quarters in a row before?
Yes, but it is uncommon. Since 2013 BTC has clustered consecutive red quarters only a few times, mainly during the 2014-2015, late-2018, and 2022 bear phases. Each cluster eventually resolved higher, but the recovery typically came after a stretch of basing rather than immediately.
What does a Fear & Greed Index reading of 18 mean for Bitcoin?
A reading of 18 is deep Extreme Fear, which signals that sentiment is washed out and sellers may already be most of the way through their selling. Historically these readings have clustered closer to local lows than to tops, though fear alone is context, not a standalone buy signal.
What are the key Bitcoin support and resistance levels right now?
With BTC at $59,658, the nearest support is $58,000 followed by $56,000, and the nearest resistance is $62,000followed by $64,000. Holding the $56,000 to $58,000 shelf keeps the structure intact, while a reclaim of $64,000 is the level that would flip the trend.
Why is Bitcoin falling into the end of Q2 2026?
The selloff has been driven by spot ETF outflows, long-term holders trimming positions, and capital rotating into AI equities, all compounding into a quarter-end window where funds rebalance their books. Some of that pressure is mechanical and tends to ease once the new quarter begins.
Bottom Line
Bitcoin at $59,658 is two days from closing a second straight losing quarter, a rare event that history treats as a warning to be patient rather than a reason to panic-sell the low. The decision rules are simple. Hold the $56,000 to $58,000 shelf and the move stays a deep correction inside a larger uptrend, with Extreme Fear at 18 hinting that sellers are getting scarce. Lose $56,000 on a daily close and the deeper bear case opens, with the longer-term moving averages as the next references. Reclaim $64,000 with ETF flows turning to net inflows and the trend flips, and the back-to-back loss becomes the basing zone it has been in every past cycle rather than the start of something worse. The first trading days of Q3 will say more than the last days of Q2.
This article is for informational purposes only and does not constitute financial or investment advice. Cryptocurrency trading involves substantial risk. Always conduct your own research before making trading decisions.