The cryptocurrency market is currently navigating a high-stakes tug-of-war as we move into the final days of February 2026. After a period of grinding downward pressure that saw Bitcoin (BTC) test the resolve of the $63,000 support floor, market data is now indicating the first signs of a mid-week relief rally.
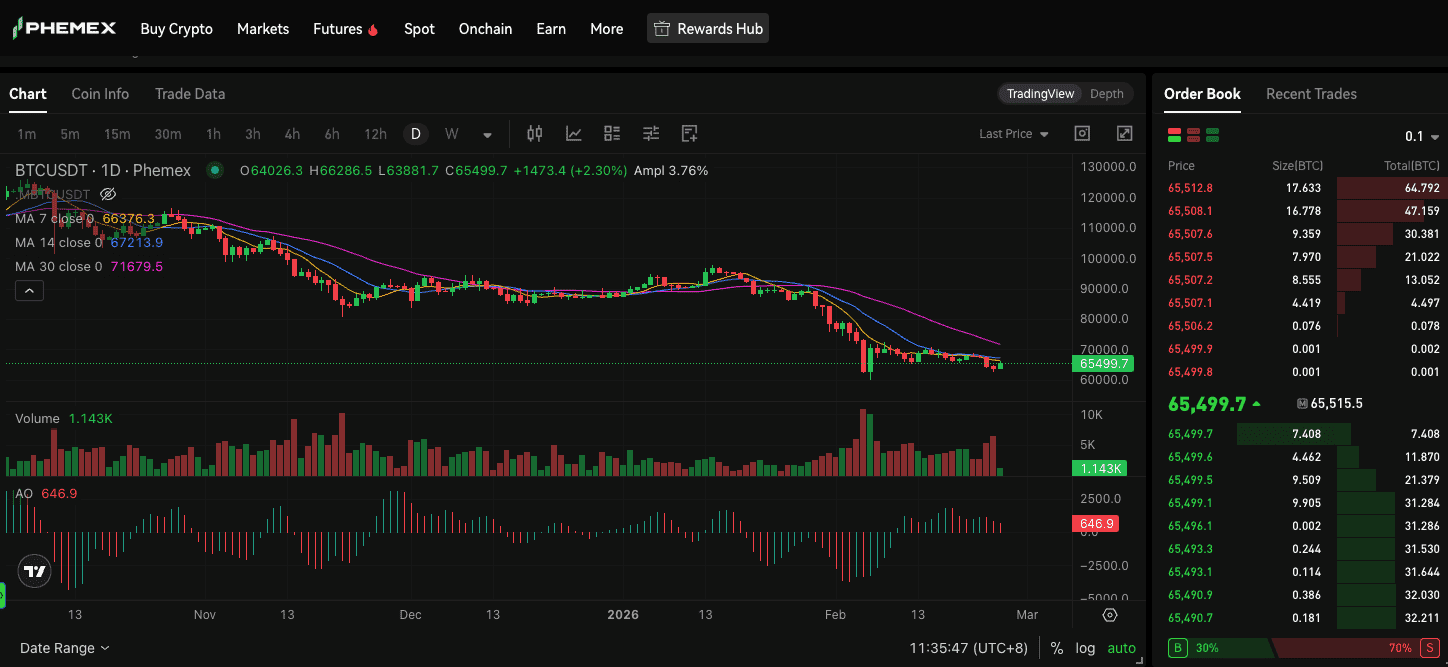
As of this morning, Bitcoin is trading at $65,499.7 USDT on Phemex, marking a +2.30% recovery in the last 24 hours. While the green on the screen provides a shift in momentum for market participants, a deep dive into the order book, moving averages, and institutional flow data suggests that this rally is encountering a formidable "Wall of Resistance" that could determine the price trend for the remainder of Q1.
1. The "What Happened" Section: Intraday Price Action (0-4h Window)
Bitcoin Fights for $65,500 Today: A Technical Summary
The intraday charts show what technical analysts often call a "defensive bounce." Earlier in the session, Bitcoin dipped to a daily low of $63,881.7, a level that saw increased activity in the derivative markets. However, buy-side liquidity in the $64,000 zone proved resilient during this test.
From the opening price of $64,026.3, the asset has climbed steadily to its current position near the $65,500 psychological milestone.
The Invisible Ceiling: The $65,512 Order Book Wall
Real-time data from the Phemex order book reveals why the price movement has stalled at this specific level. There is a significant concentration of limit sell orders—commonly referred to as a "sell wall"—stacked between $65,507 and $65,512.
Specifically, depth data shows a massive block of 17.633 BTC sitting for sale at $65,512.8. In a market environment where daily volume has been moderate (1.143K BTC), hitting a 17-BTC wall at a single price point acts as a significant liquidity barrier.
For the price to sustain momentum toward $66,000, market buyers must not only absorb this specific order but also the cumulative 64.792 BTC of sell-side liquidity sitting just above it.
Technical Context: Structural Alignment
Despite the +2.3% gain, Bitcoin remains positioned within a bearish structural alignment on the daily timeframe. It is currently trading strictly below its three primary daily moving averages:
MA 7 (Yellow): $66,376.3
MA 14 (Purple): $67,213.9
MA 30 (Red): $71,679.5
In technical analysis, a bounce that fails to recapture its short-term moving average (the MA 7) is often observed as a relief rally within a broader downtrend. To shift this intraday relief into a structural reversal, a breakout that clears the "MA 7 Wall" is typically required.
2. Sentiment Analysis: The Paradox of "Extreme Fear" vs. Institutional Buying
To understand the current "BTC bearish" or "Bitcoin price prediction" landscape for 2026, one must look at the divergence between retail sentiment and institutional activity.
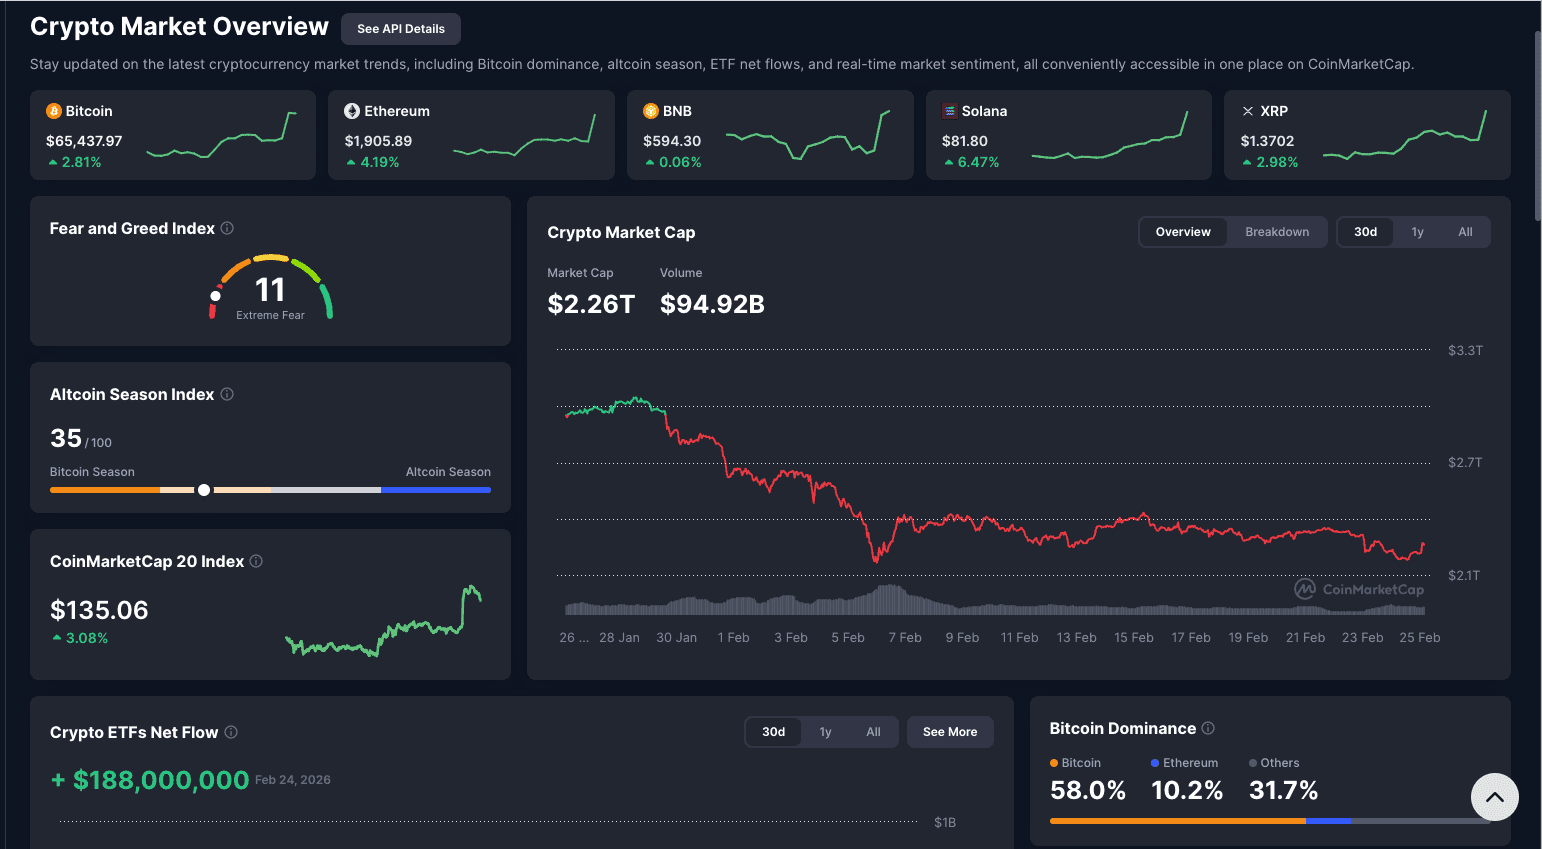
The Fear & Greed Index: 11 (Extreme Fear)
According to the latest CoinMarketCap overview, the Crypto Fear and Greed Index has dropped to 11, one of the lowest readings recorded in the 2026 cycle.
Interpretation:
Retail traders are currently in a state of "Extreme Fear." While some contrarian perspectives view such low readings as a sign of a potential market bottom, in a high-interest-rate environment, extreme fear can also trigger liquidity drain as participants rotate toward fiat yields.
The Institutional Counter-Signal: +$188M ETF Inflow
In sharp contrast to retail sentiment, Crypto ETF Net Flow data for February 24, 2026 shows a positive inflow of +$188,000,000.
Implication:
While retail sentiment remains cautious, institutional players via spot ETFs appear active in the $63K–$65K range. This institutional demand likely prevented Bitcoin from sliding further toward $60,000 during early morning volatility.
Bitcoin Dominance and Market Dynamics
Bitcoin Dominance currently stands at 58.0%. With the Altcoin Season Index at 35, the data indicates we are firmly in a "Bitcoin Season."
During periods of market stress, capital typically rotates out of volatile altcoins and back into Bitcoin. This explains why BTC is outperforming many mid-cap assets today, maintaining its role as the ecosystem’s primary liquidity hedge.
3. Deep Technical Breakdown: The MA 7 "Resistance Line"
The MA 7 Resistance (The Yellow Line)
The MA 7 is currently calculated at $66,376.3.
Earlier today, Bitcoin’s daily high reached $66,286.5, meaning price came within $90 of the MA 7 before facing rejection. This confirms that the MA 7 is acting as a dynamic resistance ceiling.
Until Bitcoin can secure a daily candle close above $66,376, the short-term technical trend remains downward.
The Awesome Oscillator (AO) Momentum
The AO indicator currently reads 646.9 with a green bar.
Positive Signal:
The green bar suggests that selling pressure is decelerating and momentum is attempting to shift back toward the bulls.
Limitation:
However, the absolute value remains relatively low compared to historical 2025 peaks, indicating that while the bleeding has slowed, explosive upside momentum has not yet emerged.
Volume Analysis
Daily volume sits at 1.143K BTC. Compared to high-volume sell-off days earlier in February, this level remains relatively thin.
Green candles on low volume are often viewed cautiously, as they may reflect a temporary absence of sellers rather than aggressive buyer conviction. For more on this, see Understanding Trading Volume in Ranges and Trends.
4. Strategic Trading Scenarios: Monitoring the Pivot
Bitcoin is currently compressed between the $64,000 support floor and the $66,376 MA 7 ceiling.
This creates two primary technical scenarios:
Scenario A: Potential Bullish Breakout
If ETF inflows continue to provide support:
Trigger:
A 4-hour candle close above $66,400 would flip the MA 7 from resistance to support.
Next Targets:
MA 14 at $67,213
Psychological resistance at $68,000
Risk Note:
Watch for fake-outs where price wicks above resistance but fails to hold.
Scenario B: Bearish Rejection (Trend Continuation)
Given extreme fear conditions and positioning below major MAs:
Trigger:
Failure to clear the $65,512 sell wall or another rejection near $66,300.
Downside Risk:
Re-test of $63,881 daily low
If broken, next major support near $61,500
5. Conclusion: A Market at a Crossroads
February 25, 2026 represents a technical standoff.
On one side:
Retail Extreme Fear
MA 7 resistance at $66.3K
On the other side:
+$188M ETF inflows
Bitcoin dominance at 58%
For intraday traders, $65,512 remains the immediate liquidity battleground.
For swing traders, the MA 7 at $66.3K is the decisive short-term trend pivot.
The market is coiled. While the +2.3% bounce signals stabilization, a sustained reversal toward the $70K range would likely require a confirmed breakout above the MA 7 Wall.
Until then, traders should manage leverage carefully and monitor real-time liquidity shifts on the Phemex depth chart.
Ready to Monitor the Trend?
Track real-time volatility and execute your strategy on Phemex.
Whether you're watching Extreme Fear indicators or following institutional inflows, $66.3K is the current decision zone.
Trade BTC/USDT Futures on Phemex Now
Disclaimer: Cryptocurrency trading involves significant risk. This analysis is for informational purposes only and does not constitute financial advice. Always conduct your own due diligence and assess your risk tolerance before trading.