

The percentage price oscillator (PPO) or price oscillator tool is a trading tool used for measuring momentum. Besides signaling oversold and overbought areas as well as bearish and bullish price moves, PPO also shows the relationship between two moving averages in terms of percentage.

What is a Percentage Price Oscillator (PPO) Indicator?
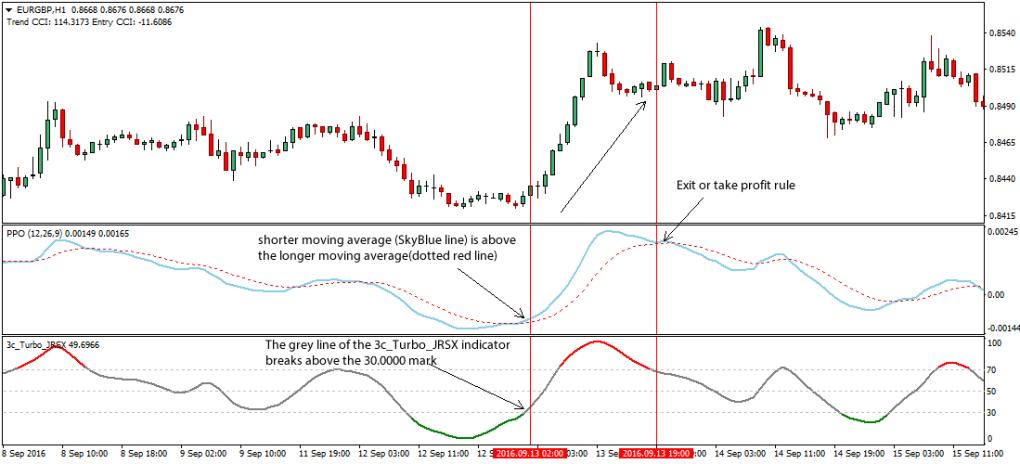
The PPO indicator, like many technical analysis tools, is based on a moving average that helps traders find out what direction a particular asset may move in the near future. It uses two moving averages – one over a shorter period and one over a longer period. It then averages that information to show a trend. Additionally, it helps compare the performance of assets, as well as their volatility. Here is an example from Dophintrader:
Since PPO is based on the Exponential Moving Average (EMA), the latest price data has more weight. The longer EMA provides more gradual moves as it captures greater price data. On the other hand, the shorter EMA moves faster as the period shortens. Like Moving Averages Convergence Divergence (MACD) indicator, PPO also helps traders measure the difference between 12-period and 26-period EMA. The difference is while MACD reports the absolute difference between two moving averages, the PPO shows it as a percentage.
How to Identify a Trend Using PPO?
If PPO is showing any point above zero, it often indicates a bullish trend because the short-term moving average is above the long-term moving average. A trader might consider such an opportunity as a buy signal. Likewise, when the PPO is below zero, the short-term moving average is below the long-term moving average, which is a clear indicator of an incoming downtrend. Traders might want to consider this indication as a sell signal.
How to calculate PPO?
The formula to calculate PPO is:
PPO = (Fast_EMA – Slow_EMA) / Fast_EMA
*Calculate the shorter period, which is 12-period EMA.
*Calculate the longer period, which is 26-period EMA.
*The 12-day and 26-day EMA is the standard. However, a trader can change these parameters according to the preferences.
In simpler terms, deduct the 26-day EMA from the 9-day EMA and then divide the difference by the 26-day EMA. The final sum shows where the short-term is relative to the long-term EMA.
PPO vs. MACD: Is PPO Better than MACD?
Both indicators have their own set of benefits. While MACD allows traders to measure absolute movements, PPO measures percentage movements. However, as cryptocurrencies are highly volatile, MACD readings aren’t very helpful when comparing two different assets. With PPO, you can easily compare one asset to another. For example, if the price of BTC is reaching 2 on PPO, it indicates a stronger movement than any other asset that is below 2.
what is an “ADX PPO Pinch”?
Furthermore, the PPO indicator can be used in conjunction with the ADX indicator. A lot of traders call this combination an ‘ADX PPO Pinch’ or ‘Squeeze. It works when the traders plot the PPO in a pane directly above the ADX, which then ‘squeezes’ together with two plots visually on a chart.
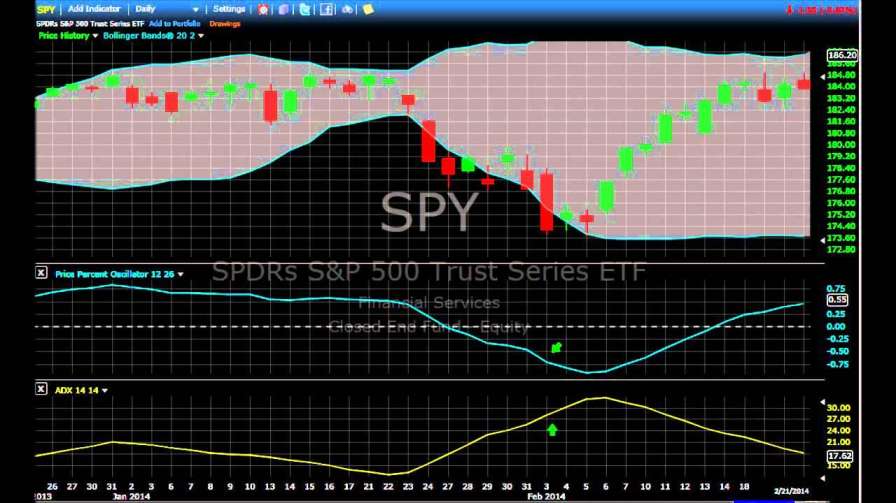
Example of ADX PPO Pinch (source)
Advantages of Using PPO indicator
- In addition to identifying trades based on the direction, the PPO indicator also helps traders stay in trades for as long as the trend lasts.
- Traders can also use it to find out the divergence of trades in a market. Using this strategy, traders can watch when the PPO indicator starts to behave differently from regular price actions. In most cases, such fluctuations are the indicator of a possible divergence.
Closing Thoughts
PPO is a crucial indicator that traders can highly benefit from. Though it is often compared to MACD, it differentiates itself by providing an added dimension as a percentage version of MACD. However, like all trading indicators, PPO has its trade-offs as it cannot identify purely oversold or overbought conditions without the help of other indicators.
At the same time, a lot is dependent on the trader as they must know how to manage their risk properly. They shouldn’t allow single trade to take more than a specific amount of equity, irrespective of the trend directions.
Read More
- What Is Detrended Price Oscillator (DPO): Identifying Broader, Underlying Price Cycles
- What is Balance of Power (BOP) Indicator: Measure the Strength of Buying and Selling Pressure
- What is Point of Control: How to Use PoC in Crypto Trading
- Stochastic Oscillator: Everything You Need To Know
- SMA Trading Strategies for Crypto Trading
- What Is Volume Oscillator (VO) in Crypto Trading?
- What Is Oscillator Trading: Top 5 Indicators To Use
- What is Chande Momentum Oscillator (CMO): An Alternative to the RSI Indicator