
Summary
-
The Heikin-Ashi is a technical analysis technique used with traditional candlestick chart.
-
Heikin-Ashi vs. Candlestick: A distinct visual difference between the Heikin-Ashi and a traditional chart is that is smooths out the traditional candlestick by using a modified formula.
-
The primary benefit of the Heikin-Ashi is that it makes charts more reader-friendly and helps users identify and analyze trends.
-
Because the Heikin-Ashi doesn’t provide averaged price information, real-time prices, and it is slow to react to volatility, making it ill-suited for scalpers and high-frequency traders.
Crypto markets can be chaotic, with prices zigzagging up and down and candlestick charts often looking like a sea of noise. Enter Heikin-Ashi: a charting technique that can make those price trends clearer and easier to interpret. Meaning “average bar” in Japanese, Heikin-Ashi is a special type of candlestick chart that smooths out price data. It does this by averaging prices over periods, resulting in charts that filter out much of the short-term volatility. For crypto-curious readers and intermediate investors, using Heikin-Ashi charts can be a game-changer because in a highly volatile market like crypto, it’s easy to get spooked by every minor fluctuation. Heikin-Ashi helps you stay focused on the bigger trend, so you can trade with more confidence and avoid emotional whiplash from rapid price swings.

What is the Heikin-Ashi?
Heikin-Ashi is a technical analysis technique used with traditional candlestick charts when trading cryptocurrencies, stocks, commodities, etc. Heikin-Ashi represents a charting method that smooths out price action by averaging candlestick data. Unlike standard candlestick charts that display the exact open, high, low, and close for each period, Heikin-Ashi candles utilize averaged values, which dampen wild price fluctuations.
The key calculations for a Heikin-Ashi candle are:
-
Close: Average of the open, close, high, and low of the current period.
-
Open: Midpoint of the previous candle’s open and close.
-
High: Maximum of the current period’s high, open, or close.
-
Low: Minimum of the current period’s low, open, or close.
This method results in smoother charts with consecutive colored candles, making trends and reversals more visible. Heikin-Ashi is particularly useful for identifying trends, reducing false signals, and is popular among swing traders and long-term investors in crypto.
It’s important to note that Heikin-Ashi is not an indicator but a different way to represent price data, which means the last candle's close may not align with the actual market price.
Benefits of the Heikin-Ashi
The primary benefit of the Heikin-Ashi is that it makes charts more reader-friendly and helps users identify and analyze trends, which is the bread and butter of making profitable trades. It does this by smoothing out the traditional candlestick chart and significantly cutting out noise.
There is a saying among traders that “the trend is your friend,” and the Heikin-Ashi technique best illustrates this sentiment.
Psychology behind the Heikin-Ashi
The Heikin-Ashi technique significantly influences trader psychology by smoothing out chart patterns, which helps mitigate emotional responses to market fluctuations. In a standard candlestick chart, a trader may react impulsively to each candle—green signals positivity and red triggers concern—leading to emotional trading decisions like panic selling during minor corrections. Heikin-Ashi charts filter out these smaller movements, reassuring traders that the trend remains intact, which encourages patience and discipline.
For instance, during an upward trend in Bitcoin, a regular chart may show mixed signals that induce doubt and second-guessing after a single red candle. Conversely, a Heikin-Ashi chart might display a sequence of green candles, instilling confidence and reducing the likelihood of premature actions. This technique also clarifies actual trend reversals, as a pronounced shift in candle color stands out more starkly, helping traders avoid getting frayed by minor fluctuations.
Additionally, the clustered candle colors on Heikin-Ashi charts can lower stress levels, making traders less prone to impulsive decisions and fostering a calm approach to market movements. However, there’s a caveat: the muted volatility might create a false sense of security, potentially leading traders to overlook significant price drops.
In summary, Heikin-Ashi encourages traders to focus on the overall trend rather than getting caught up in minor price movements, which is particularly useful in the highly volatile crypto market. Understanding this psychological aspect can enhance trading strategies.
How is the Heikin-Ashi formulated?
The Heikin-Ashi technique is similar to traditional candlestick charts, but it has a distinct visual difference.
Whereas normal candlesticks charts are created by creating bars and wicks — which illustrate an asset’s open, high, low, and closing price — the Heikin-Ashi uses a modified formula.
How to calculate Heikin Ashi candles
The candlestick’s close is determined as follows:
Close = ¼ (Open + High + Low + Close)
The candlestick’s open is determined as follows:
½ (Previous bar’s open + Previous bar’s close)
The candlestick’s high is determined as follows:
High = Max [High, Open, Close]
The candlestick’s low is determined as follows:
Low = Min [Low, Open, Close]
Heikin-Ashi Chart vs. Traditional Candlestick Chart
Visually, a Heikin-Ashi chart looks similar to a normal candlestick chart, but the modified candlestick formulas create distinct visual trends.
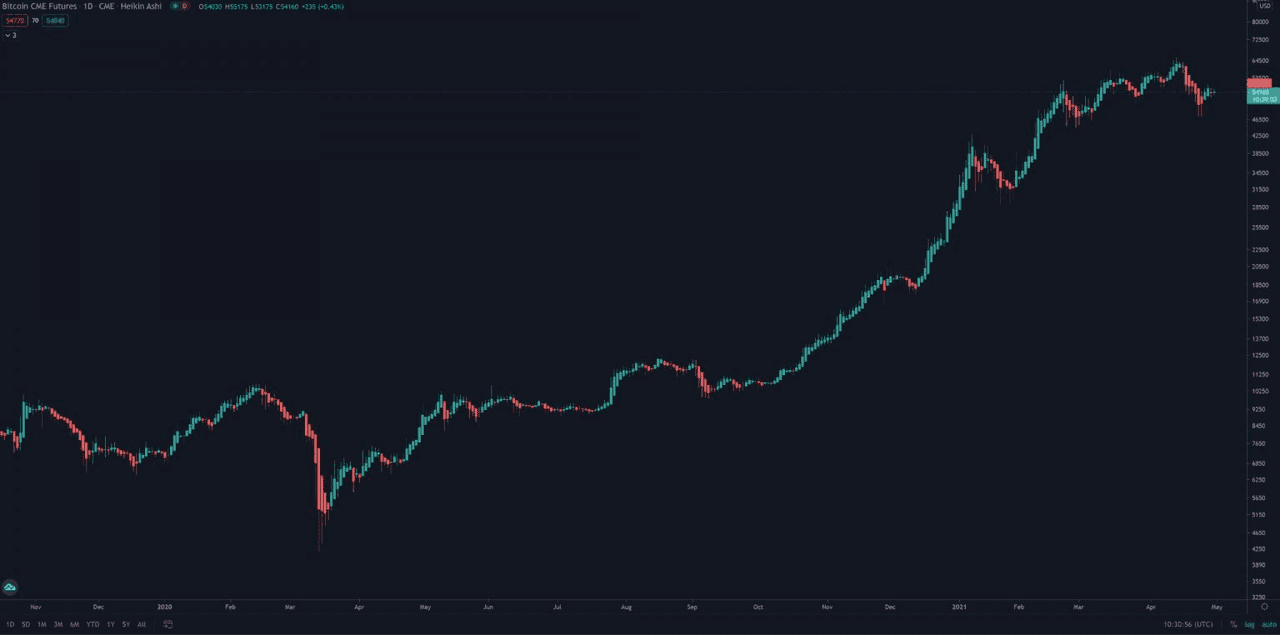
The Bitcoin CME Futures daily chart using the Heikin-Ashi technique. Source: TradingView
As illustrated in the above chart, a Heikin-Ashi chart looks significantly smoother, with trends clearly defined — uptrends remain green, despite down days, while downtrends remain red, despite up days. This allows traders to identify and analyze the strength of an asset’s current trend.
Another key differentiator is that the current price of a cryptocurrency or asset on a normal candlestick chart may be different than the current price on a Heikin-Ashi chart. This is due to the fact that normal candlestick charts look at closing prices, while Heikin-Ashi charts take an average.
How to trade the Heikin-Ashi
Trading with the Heikin-Ashi technique is easier than many other technical analysis techniques, thanks to its smooth and simplified appearance.
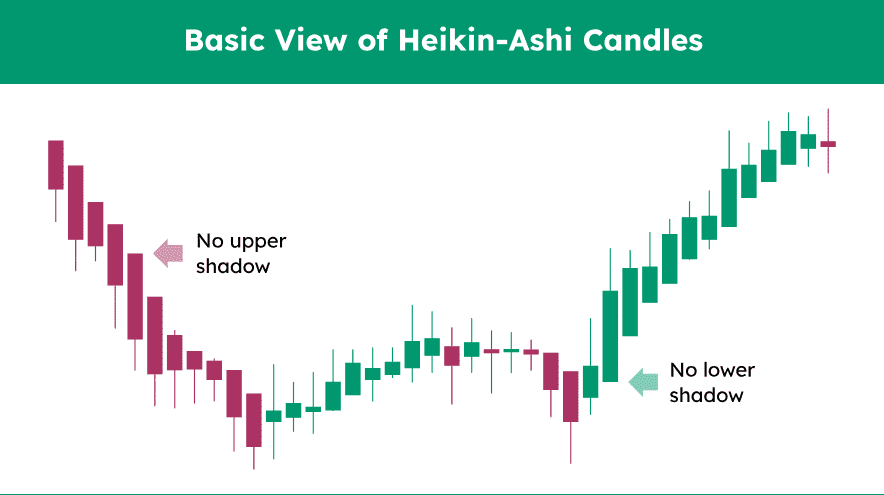
For example, green candlesticks with no lower wicks are indicative of a strong uptrend, so traders in profit may be dissuaded from taking profits. Being indicative of an uptrend, green candles may also signal to traders that they might want to increase their long positions or exit their short positions.
Trend changes are usually indicated by Heikin-Ashi candles with small bodies with wicks on both the top and bottom. In a conservative trading strategy, this indicates that a trader should look for confirmation before entering a long or short position to capitalize on the trend change.
Opposite to green candles are red candles, which indicate a downtrend and may signify a time to add to short positions or exit long positions. Likewise, red candles with no upper wicks indicate a strong downtrend, so traders in profitable short positions may patiently wait to realize profits.
Being a smoothed-out chart that is easy to read, Heikin-Ashi often gives fewer false signals than other technical techniques or indicators. Generally speaking, traders usually remain in a profitable trade until the Heikin-Ashi changes color — though, naturally, this does not guarantee that a trend will change.
Best Practices when trading with Heikin-Ashi
Like all technical analysis techniques and indicators, the Heikin-Ashi is best used in conjunction with other technical indicators — such as support and resistance levels — and in a well-defined and carefully considered trading strategy. No technique guarantees success, and techniques rarely turn the most profits when used in isolation.
Trading with Heikin-Ashi focuses on utilizing clearer trend signals for better entry and exit decisions. Here are some concise strategies and best practices:
-
Ride the Trend: Stay in trades longer during strong trends. If you see multiple consecutive candles of the same color without opposing wicks, consider letting the trade run. For instance, if there are several green candles, resist taking profits prematurely.
-
Exit on Color Change: Have clear exit rules. For example, exit when a candle of the opposite color appears. Some traders take partial profits at the first sign of weakness (like a small candle) and exit the rest on a full color change.
-
Combine with Indicators: Pair Heikin-Ashi with traditional indicators for confirmation. Use moving averages or oscillators like RSI/MACD to validate trends and momentum, strengthening your decisions.
-
Entry Timing: Use Heikin-Ashi for trend identification but check real price for precise entries. Consider using regular candlesticks or a lower timeframe for better timing, and wait for a minor pullback to enter.
-
Trailing Stops and Bots: Use trailing stop orders based on Heikin-Ashi signals to lock in profits. Advanced users might implement trading bots adhering to Heikin-Ashi trends, removing emotional decision-making.
-
Multiple Timeframe Analysis: Analyze multiple timeframes to refine your strategy. Use a higher timeframe for the primary trend and lower timeframes for entry points to align with the overall trend.
-
Avoid Overtrading in Chop: In choppy markets with alternating candle colors, refrain from trading. Wait for clearer trends to avoid false starts and losses.
Discipline is key in trading with Heikin-Ashi. Trust the method and follow the trends as indicated by the charts.
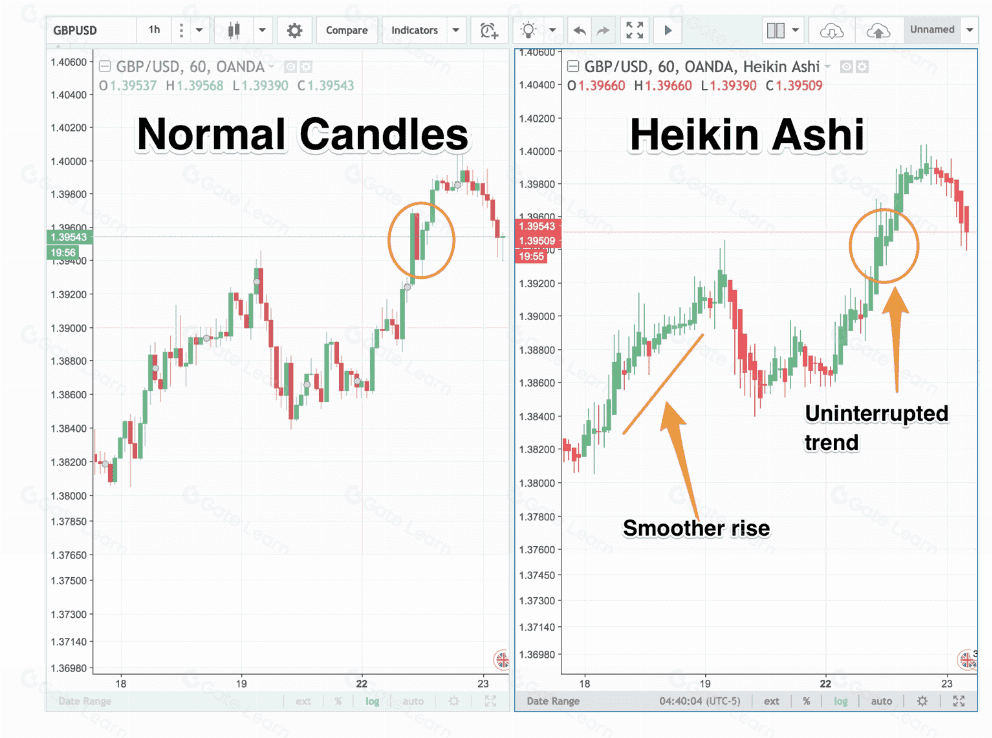
Normal candles vs. Heikin-Ashi
What are the limitations of Heikin-Ashi?
Heikin-Ashi is a helpful tool, but it’s not without drawbacks. Being aware of its limitations will ensure you use it appropriately and don’t get caught off guard:
-
Lagging Indicator: Because Heikin-Ashi uses averaging, it has a built-in lag. The smoothing that makes trends look nice also means you might see a reversal signal a bit later than on a normal chart. For example, suppose a sudden sharp reversal happens (maybe due to a piece of news). The regular candlesticks might immediately show a big reversal candle, but the Heikin-Ashi might take an extra period to fully reflect that change. If you rely solely on Heikin-Ashi, you could give back some profit or enter a trade late. Therefore, if you need a signal to trigger a trade in a range-bound market, Heikin-Ashi won’t be that trigger – it’ll likely be non-committal. It’s best paired with other analyses for timing actual breakouts or breakdowns.
-
Conservative: The primary limitation of the Heikin-Ashi technique is that it is perhaps too conservative. Because it uses averaged price information, trade set-ups take longer to develop — making it ill-suited to high-frequency traders or low-time frame scalpers. The technique simply does not react quickly enough for these purposes. Rather, the Heikin-Ashi technique is better suited for swing traders looking to exercise a large amount of patience.
-
Lack of Precision on Entries/Exits: Heikin-Ashi candles don’t show the actual closing price for the period (since it’s an average). This means if you try to use them to set exact entry, exit, or stop levels, you might be a bit off. For instance, a Heikin-Ashi chart might show a value of $10,000 while the actual price is $10,200. If you place an order thinking the price is $10,000, you’d be mispricing it. Thus, for order execution and setting stops, always check the actual price chart. One common approach is to do analysis on Heikin-Ashi but execute trades on the normal candlestick chart.
-
Concealing Price Gaps or Sudden Moves: In crypto, true gaps are rare (since trading is 24/7), but on smaller coins or during exchange off-hours, there can be jumps. Heikin-Ashi can mask some of these, since it plots a smooth transition. If a price jumps down and then up within one period, a regular chart shows a V-shape or a wick; Heikin-Ashi might flatten that out. If you were watching only Heikin-Ashi, you might miss the fact that, say, the price briefly hit a very low level (which could have been a great buy opportunity or important info). In short, Heikin-Ashi sacrifices some detail.
-
Not Ideal for Sideways Markets: In range-bound conditions, Heikin-Ashi might keep flipping colors, as noted. Using it in such times can lead to whipsaw signals – basically telling you “trend up, no down, no up again” when in reality nothing significant is happening. If you find your Heikin-Ashi chart alternating frequently and not showing a clear direction, it may be better to shift your strategy (maybe focus on support/resistance tactics or just wait it out). Heikin-Ashi shines in trending markets; it’s less useful in flat or low-volatility markets.
-
Hidden Real-Time Data: When day trading or scalping, the actual current price is crucial. Heikin-Ashi, due to averaging, might show a candle that hasn’t “flipped” color yet, but the real-time price could be moving opposite. Traders in short timeframes often need to know exactly where price is relative to a level at every second. In these cases, Heikin-Ashi might hinder more than help. Therefore, for very short-term trading, or if you need to see exact price interactions (like price touching a specific resistance line to the dollar), Heikin-Ashi might not be the best choice.
-
Complex Indicators on Heikin-Ashi: If you use technical indicators (like RSI, MACD) on top of a Heikin-Ashi chart, be cautious. Those indicators will be calculating based on the Heikin-Ashi values, not the actual price. This can sometimes give slightly different readings than they would on a normal chart. It’s not necessarily bad, but it’s something to be aware of – the indicator might say “oversold” when actual price-based indicator is not, due to smoothing. A practical fix is to base your indicators on actual price even if the candles are Heikin-Ashi (some charting tools allow you to specify the source price for indicators).
-
Transition Confusion: When switching from regular candles to Heikin-Ashi, new users might get confused about things like “Where is the actual price? How do I see volume at price?” etc. Volume bars remain the same, but Heikin-Ashi doesn’t affect volume. It’s purely price display. However, certain patterns like exact candlestick formations (hammers, shooting stars, etc.) don’t translate 1-to-1 on Heikin-Ashi. Don’t try to identify all the usual candlestick patterns on a Heikin-Ashi chart; they have their own logic of interpretation as we covered. So if your strategy revolves heavily around precise candlestick patterns (beyond the trend reading), Heikin-Ashi might not be suitable.
In summary, don’t use Heikin-Ashi in isolation for critical decisions that require precision or immediate reaction. It’s best employed as a guide for the general trend and as a filter for noise. Many traders will glance at both charts – Heikin-Ashi for trend context and normal candlesticks for exact price and patterns – to get the full picture. If you know a big event is coming, recognize that Heikin-Ashi won’t give you a magic shield; you still need to manage risk as though anything can happen.
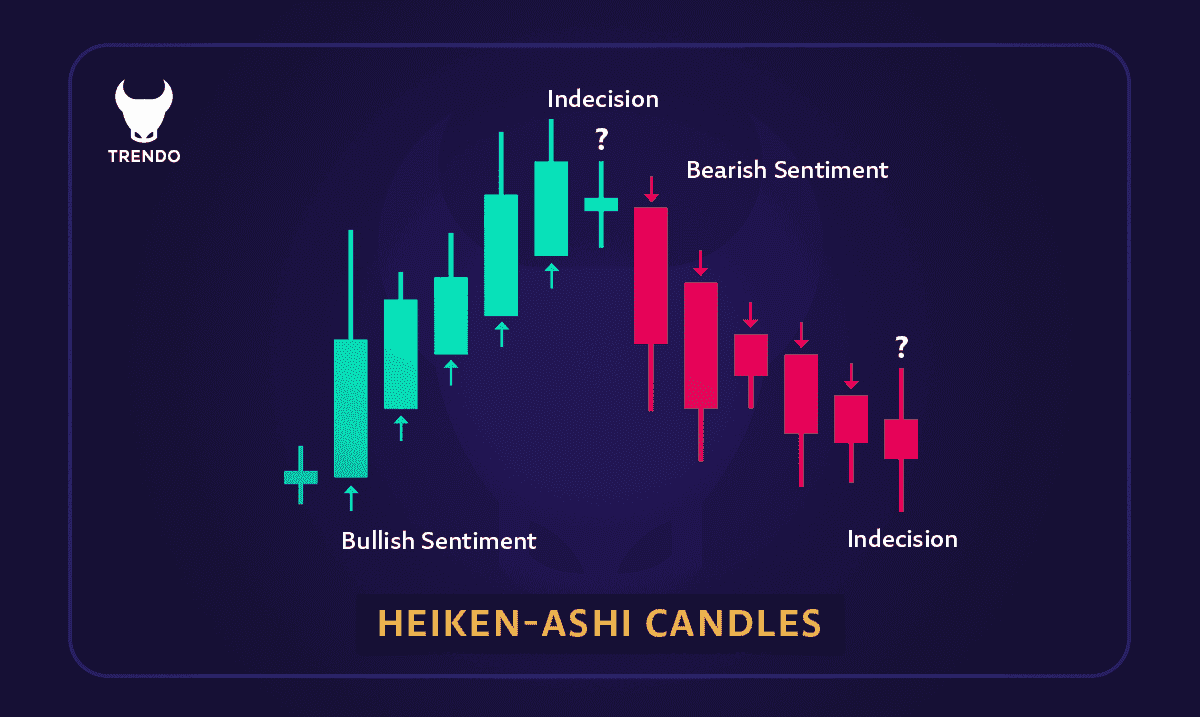
Bullish and Bearish sentiment on Heikin-Ashi
Conclusion
The Heikin-Ashi technique is a beginner-friendly and highly readable technical analysis technique that cuts out the noise and illustrates clearly defined trends. By averaging price data, they strip away much of the “market noise” that can lead to emotional decision-making. Even the most novice trader can look at a Heikin-Ashi chart and understand a cryptocurrency or asset’s trend. However, it is this simplicity that is also the Heikin-Ashi technique’s biggest flaw. Because it presents averaged price information, real-time prices are largely abandoned and the technique is slow to react to volatility — making it ill-suited for scalpers and high-frequency traders.
For those keen to implement Heikin-Ashi in their crypto trading, having the right platform matters. Phemex is an excellent choice to put these insights into practice. On Phemex’s trading interface, you can easily switch your chart type to Heikin-Ashi, enabling you to leverage this technique directly while trading. Whether you’re trading spot or futures, Phemex provides a professional-grade environment with advanced trading tools like trading bots and customizable charts so you can apply techniques like Heikin-Ashi seamlessly.