

The Wyckoff Method, developed by Richard Wyckoff in the early 1900s, is a technical analysis framework that helps traders decode market cycles by tracking the actions of institutional investors, or "smart money." By identifying accumulation (buying) and distribution (selling) phases, traders can anticipate price trends, making the method especially powerful in volatile markets like crypto. This Phemex Academy guide explains the Wyckoff Method, its key phases, and how to trade them effectively.
Who Was Richard Wyckoff?
Richard Wyckoff was a pioneering stock trader who amassed wealth through disciplined market analysis. Frustrated by large institutions exploiting retail traders, he formalized his strategies into the Wyckoff Method, sharing them through his Magazine of Wall Street and Stock Market Technique. His approach, still relevant today, helps traders align with smart money in stocks, crypto, and other markets.
Core Principles of the Wyckoff Method
The Wyckoff Method rests on three foundational laws and a key concept:
-
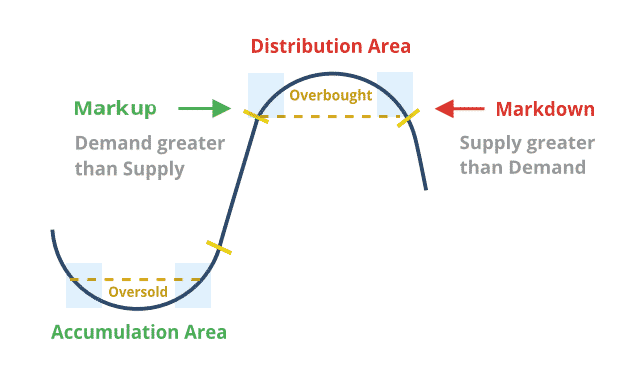
Law of Supply and Demand: Prices rise when demand exceeds supply, fall when supply exceeds demand, and stabilize when balanced.
-
Law of Cause and Effect: The extent of accumulation or distribution (cause) determines the size of the price move (effect).
-
Law of Effort vs. Result: Volume (effort) should align with price movement (result). Divergences, like high volume with little price change, signal reversals.
-
Composite Man: Wyckoff’s metaphor for institutional traders who drive market trends. Understanding their actions—accumulating at lows or distributing at highs—helps traders anticipate moves.
Wyckoff Market Cycle
Markets move through four phases:
-
Accumulation: Smart money buys after a downtrend, forming a sideways range.
-
Markup: Prices rise as demand grows, often after a breakout.
-
Distribution: Smart money sells after an uptrend, creating another range.
-
Markdown: Prices fall as supply overwhelms demand.
-
Re-accumulation (pauses in uptrends) and redistribution (pauses in downtrends) occur within these cycles, acting as continuations or reversals.
Wyckoff Accumulation: Key Phases
Accumulation is a range-bound phase after a downtrend where smart money builds positions. It unfolds in five phases (A–E), identifiable by price and volume patterns.
-
Phase A: Downtrend Slows
-
Preliminary Support (PS): Buying emerges, with higher volume and slowing declines.
-
Selling Climax (SC): Panic selling spikes volume and widens spreads, often with a long lower wick as buyers intervene.
-
Automatic Rally (AR): Prices rebound as shorts cover, setting the range’s upper boundary.
-
Secondary Test (ST): Prices retest SC lows with lower volume, showing reduced selling.
-
-
Phase B: Building Positions
-
Smart money accumulates within the range, with price swings testing supply and demand.
-
Volume drops on down moves, signaling weak selling pressure.
-
-
Phase C: The Spring
-
A false breakdown below support shakes out weak holders.
-
Price quickly recovers, indicating strong demand. Springs are not always present.
-
-
Phase D: Pre-Breakout
-
Sign of Strength (SOS): A strong upward move with high volume shows buyer control.
-
Last Point of Support (LPS): A pullback tests support with low volume, confirming demand.
-
-
Phase E: Markup
-
Price breaks above resistance with high volume, starting the uptrend.
-
Pullbacks to new support offer additional entries.
-
Wyckoff Distribution: Key Phases
Distribution occurs after an uptrend, where smart money sells within a range. It mirrors accumulation across five phases.
-
Phase A: Uptrend Peaks
-
Preliminary Supply (PSY): Selling increases with higher volume after a rally.
-
Buying Climax (BC): Retail buying pushes prices higher, letting smart money sell at premiums.
-
Automatic Reaction (AR): Prices drop as demand fades, setting the range’s lower boundary.
-
Secondary Test (ST): Prices retest BC highs with lower volume, showing weak demand.
-
-
Phase B: Selling Off
-
Smart money sells within the range, often with volatile swings.
-
Volume rises on down moves, indicating selling pressure.
-
-
Phase C: Upthrust After Distribution (UTAD)
-
A false breakout above resistance traps late buyers.
-
Price reverses quickly, confirming weak demand. UTAD is optional.
-
-
Phase D: Weakness Emerges
-
Sign of Weakness (SOW): A sharp drop with high volume signals seller dominance.
-
Last Point of Supply (LPSY): A weak rally fails to reach prior highs, testing support.
-
-
Phase E: Markdown
-
Price breaks below support with high volume, starting the downtrend.
-
Rallies to new resistance offer short-selling opportunities.
-
Trading Wyckoff Patterns
To trade Wyckoff patterns, align with smart money using price, volume, and market context. Below are strategies for accumulation and distribution.
Trading Accumulation
-
Entry Points:
-
Buy near support after a spring or secondary test, with a stop-loss below the spring low.
-
Enter on a breakout above resistance with high volume, or on a pullback (LPS) for confirmation.
-
-
Volume Signals: Low volume on down moves and high volume on up moves confirm bullish momentum.
-
Scaling In: Add positions at the spring, LPS, or breakout to manage risk.
-
Exit Strategy: Take profits in the markup phase at prior resistance or when distribution signals (e.g., lower highs, high volume) appear.
Example: If Ethereum falls from $4,000 to $2,000 and ranges between $1,800 (support) and $2,200 (resistance), buy after a spring at $1,750 that recovers quickly. Add on a breakout above $2,200 with strong volume. Set a stop-loss below $1,750.
Trading Distribution
-
Entry Points:
-
Short near resistance after an UTAD or SOW, with a stop-loss above the range high.
-
Short on a breakdown below support with high volume, or on a weak rally (LPSY).
-
-
Volume Signals: High volume on down moves and low volume on rallies confirm bearish momentum.
-
Exit Strategy: Cover shorts in the markdown phase at prior support or when accumulation signals (e.g., higher lows, high volume) emerge.
Example: If Bitcoin rises to $70,000 and consolidates between $68,000 (support) and $72,000 (resistance), short after an UTAD at $73,000 that fails. Confirm with a breakdown below $68,000 and high volume. Set a stop-loss above $72,000.
Risk Management
-
Use stop-losses to limit losses: below support for long trades, above resistance for shorts.
-
Scale positions based on risk tolerance and account size.
-
Confirm patterns with broader market trends using multiple timeframes (e.g., weekly for trend, daily for entries).
-
Combine Wyckoff with indicators like RSI or moving averages for added confirmation.
Wyckoff in Crypto Markets
The Wyckoff Method excels in crypto due to its volatility and institutional involvement. Historical examples, such as Bitcoin’s accumulation phase in 2015–2016 before its 2017 bull run, demonstrate its reliability. However, patterns can fail due to unexpected events, so cross-verify with other technical tools like support/resistance levels or Fibonacci retracements.
Conclusion
The Wyckoff Method empowers traders to anticipate market moves by tracking smart money. By mastering accumulation and distribution phases, you can buy low and sell high, turning volatile ranges into opportunities. Practice on historical charts, monitor volume, and trade on a platform like Phemex, which offers spot trading, futures, and automated bots to execute Wyckoff strategies efficiently.