



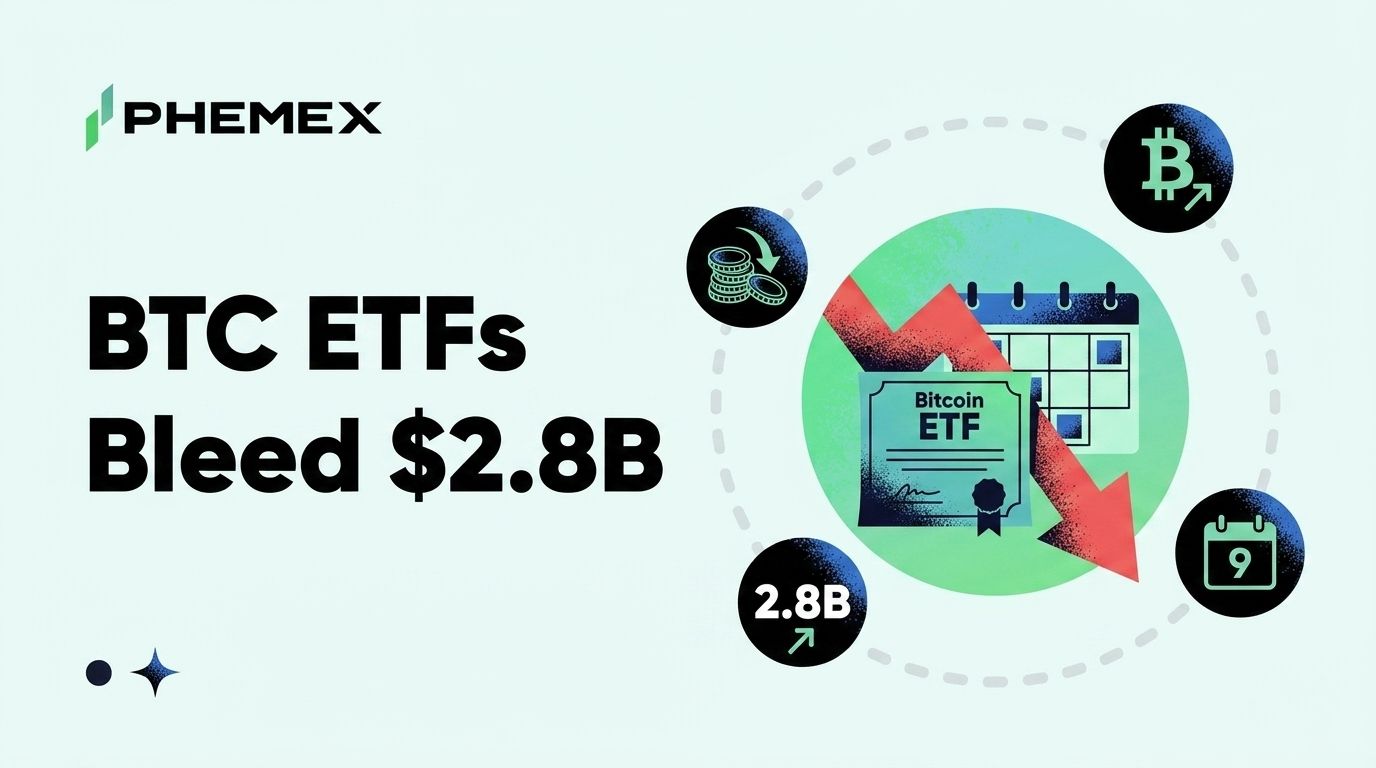
Spot Bitcoin ETFs have now bled a cumulative $2.8 billion across nine straight trading sessions, the longest negative streak since the January 2024 launch. Bitcoin sits at $74,879 this morning, off roughly 9% from the May 6 high near $82,000. Tuesday alone delivered a $333 million net outflow, with IBIT taking the heaviest hit including the May 26 dark-pool block that moved $1.29 billion in a single print. The pattern is no longer noise. It is a sustained institutional retreat that has not paused for any single positive headline, including the pending 60-day extension of the Iran truce that Trump is expected to sign this week.
What makes the streak unusual is not the dollar figure on its own. It is the fact that the redemption pressure has held through the kind of macro headlines that normally produce at least one green day. Here is what the outflow data is actually telling traders, how it compares to the February 2026 post-FOMC unwind, and what levels matter from here.
How the 9-Day Streak Compares to Every Previous Outflow Period
The January 2024 launch produced one early redemption period as GBTC unwound legacy positions, but those outflows were structural, tied to the conversion mechanics rather than sentiment. Strip out the GBTC noise and the current streak is the worst sustained selling the spot ETF complex has seen in its 16-month operating history.
The February 2026 stretch was the closest comparison. After the January FOMC, ETFs bled roughly $1.6 billion across six sessions before flows turned positive again. That episode resolved within a week because the underlying narrative shifted. CPI came in softer than feared, and money returned. This time the trigger is different and the response has been deeper.
IBIT has taken the bulk of the damage. The May 26 dark-pool print of $1.29 billion in a single block tells you a large allocator chose to exit rather than hedge through futures, which is the kind of decision that comes from a portfolio committee, not a trading desk. When the exit is institutional rather than retail, the flow pattern tends to last longer because the position size requires multiple sessions to unwind cleanly.
FBTC and ARKB have also seen consistent net outflows over the same window, though at smaller scale. The fact that the pressure is spread across the major issuers rather than concentrated in a single product confirms this is a category-wide repositioning rather than an issuer-specific story.
What Is Actually Driving the Selling
Three forces are stacking at the same time.
The Iran truce extension uncertainty. Trump's pending 60-day truce extension has not been signed at the time of writing, and prediction markets are pricing the renewal at roughly even odds. Bitcoin spiked from $74,192 to $77,000 on May 23 when the original truce was announced. The unwind of that rally has been mechanical, with traders selling into any rip until the extension is locked in. Polymarket's Iran peace contract has crossed $154 million in volume, which is now the canonical real-time gauge for how this resolution is being priced.
The post-FOMC unwind that never fully resolved. May's Fed meeting held rates and the dot plot showed no cuts before December. That outcome was priced in, but the SEP raised the 2026 inflation forecast to 2.7%, and seven committee members now project zero cuts this year. The shift in the hawkish minority has shown up in ETF flow data more clearly than in spot price action, suggesting institutional models updated their expected real rate path even though the headline number was a hold.
Strong-dollar pressure. DXY has held above 104 for three weeks, which historically correlates with weaker crypto inflows. Every time DXY has held above this level for more than ten sessions in the past 18 months, spot BTC ETF flows have turned negative within five trading days. The pattern just played out again.
For deeper context on how to read ETF flow signals against price action, the Phemex academy guide on Bitcoin ETF flows explained walks through the mechanics.
Where BTC Goes From Here
At $74,879, BTC is sitting on the upper edge of a support zone that has been tested twice in May. The $74,200 area held on May 18 and again on May 25, which makes it a level the spot market has defended actively.
|
Level
|
Type
|
What It Means
|
|
$77,000-$77,500
|
Resistance
|
Reclaim required to invalidate the streak
|
|
$74,200-$74,800
|
Active support
|
Twice-tested in May. Defense level.
|
|
$71,500
|
Structural support
|
Below this, the post-FOMC bottom retest begins
|
|
$68,800
|
Major support
|
Last untested major demand zone
|
The signal that the streak is about to end is straightforward. Watch for one of two things. Either ETF flows print a positive single session north of $200 million net, which would suggest the institutional unwind is complete, or BTC reclaims $77,500 on rising spot volume, which would force shorts to cover and pull flows back in.
If neither happens and BTC breaks $74,200 with continued outflows, the next level is the $71,500 area where the May 18 low formed. A break below that pulls $68,800 into play, which is roughly the level where the post-FOMC bottom retest would complete.
What This Means for Spot Holders vs Futures Traders
Spot holders are seeing the mark-to-market damage but face no liquidation pressure. The drawdown is roughly 9% from the May 6 high, which is well within the normal range of intra-cycle corrections. For long-term holders, the streak is uncomfortable but not structural.
Futures traders face a different setup. Open interest fell sharply through the streak, according to Coinglass open interest data, which means the leverage that built into May has already been flushed. Funding rates have flipped slightly negative on the perpetual side, which historically marks zones where short squeezes become possible on any positive catalyst. The risk for shorts entering here is a reflexive bounce on a single positive ETF print or a confirmed truce extension.
This is where retail consistently gets stopped out. The crowd shorts after the move has already happened, then gets squeezed on the catalyst they were waiting for. The discipline is to size small and define risk above $77,500, not chase the breakdown.
How This Lines Up With On-Chain Signals
On-chain data adds a second lens to the ETF flow picture. Realized cap has barely budged through the streak, which tells you long-term holders are not the ones selling. The selling pressure is concentrated in coins acquired between $76,000 and $82,000 over the last six weeks, which is consistent with shorter-duration capital rotating out rather than diamond-hand supply hitting the market.
Exchange balances have ticked up modestly, which is the kind of pattern that precedes deeper selling if it continues but also resolves quickly if flows stabilize. The miner sell-side, often a tell during late-cycle stress, has been quiet. May hashprice has held above the levels that historically trigger forced selling, so the marginal supplier is not the network producer.
The takeaway is that this is a sentiment-driven institutional repositioning, not a structural unwind. The structural buyers (treasuries, long-only mandates, the holders who survived the May 2025 correction) have not flinched. That distinction matters because sentiment-driven flows tend to reverse on a single catalyst, while structural unwinds require regime change.
Frequently Asked Questions
How does a 9-day Bitcoin ETF outflow streak compare to historical norms?
It is the longest sustained net outflow streak since the January 2024 spot ETF launch, excluding the structural GBTC unwind. The February 2026 streak hit six sessions before flows turned positive. The current run is meaningfully longer and the dollar value is larger.
Is the IBIT dark-pool block a sign more selling is coming?
Not directly. A single $1.29 billion dark-pool print typically marks one large allocator exiting a position cleanly rather than the start of a wave. The risk is that other allocators on the same committee timeline make similar decisions over the following weeks, which is what creates extended streaks rather than isolated prints.
Should I buy this dip in BTC?
The historical pattern after extended ETF outflow streaks favors buyers who wait for the first confirmed positive flow day rather than catching the falling knife. Defined-risk entries with stops below $71,500 align with the pattern. Entering blind at the current level without a flow signal is closer to gambling than a setup.
What level breaks the bullish structure?
A sustained close below $71,500 with continued ETF outflows would invalidate the May support and pull $68,800 into play. Below $68,800 the structural picture changes and the conversation shifts from correction to bear leg.
Bottom Line
The 9-day, $2.8 billion outflow streak is the worst sustained institutional retreat the Bitcoin ETF complex has seen since launch. The trigger is a stack of three forces, the Iran truce extension uncertainty, an unresolved post-FOMC unwind, and DXY pressure above 104, and the resolution depends on which one breaks first.
The actionable levels are clean. Hold $74,200 and reclaim $77,500 on positive flow data and the streak is likely over. Break $74,200 on continued outflows and $71,500 comes into play with $68,800 as the last major demand zone. The catalyst that ends this is either a single positive ETF print north of $200 million or a confirmed truce extension, and one of those should arrive within the next ten trading days.
This article is for informational purposes only and does not constitute financial or investment advice. Cryptocurrency trading involves substantial risk. Always conduct your own research before making trading decisions.