The digital asset landscape is witnessing a significant shift in momentum today, February 26, 2026. After a period of price consolidation and "fake-out" movements that tested market participants' conviction, Bitcoin (BTC) has reached a notable milestone. Reclaiming the $68,000 price territory represents a key psychological level for traders and provides a technical signal to the global markets regarding the current risk appetite in the crypto sector.
Data streaming directly from the Phemex Trading Engine paints a picture of a market in a state of renewed activity. With volatility returning to the forefront and liquidity pooling around key technical levels, the current price action could define the trajectory for the remainder of the first quarter.
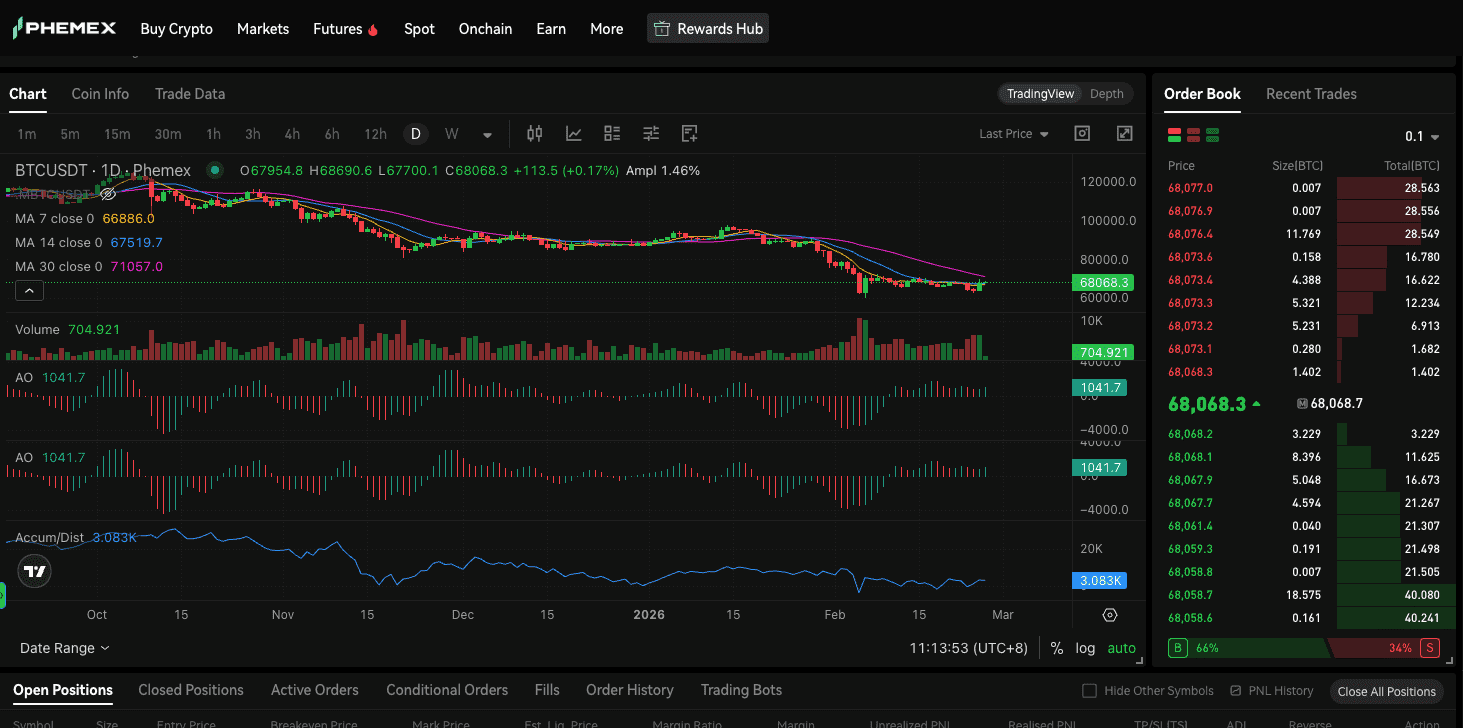
Technical Breakdown: The Daily Chart Recovery
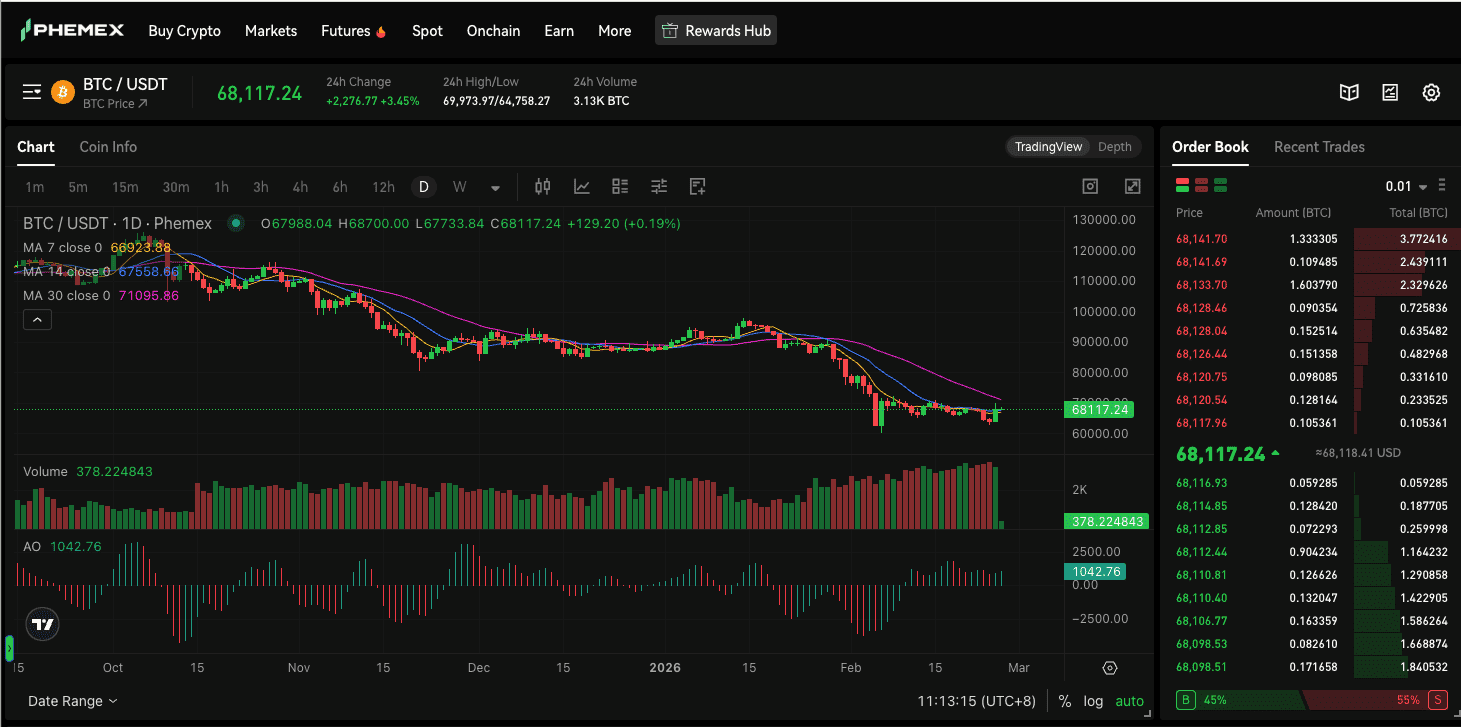
According to the Phemex BTC/USDT spot market chart, the market has executed a significant recovery over the last 24 hours. While intraday noise often distracts long-term investors, the Daily (1D) timeframe provides a clearer view of the structural shift.
Just 24 hours ago, sentiment was tested as BTC dipped to a local low of $64,758.27. This level was not reached by chance; it represents a critical liquidity pocket where buy orders had been clustered in anticipation of a potential correction. The market defense at this level was robust. From that $64.7K bottom, Bitcoin staged a 3.45% rebound, climbing to an intraday high of $68,117.24.
The Anatomy of the "Higher Low" Structure
The most significant takeaway from this price action is the structural integrity of the recent move. By bouncing from $64,758—a level notably higher than previous major swing lows—Bitcoin has established a "Higher Low" (HL) structure on the daily candle.
In technical analysis, a "Higher Low" is often interpreted as a sign of bullish intent, suggesting that selling pressure is being absorbed and buyers are willing to enter positions at higher valuations than before. This structural shift potentially concludes the short-term corrective phase observed last week and sets the technical stage for a potential retest of higher resistance zones.
Snapshot from the Phemex Spot Dashboard:
Current Price: $68,117.24
24h Volatility Range: $64,758.27 (Low) ↔ $69,973.97 (High)
Technical Indicator (AO): The Awesome Oscillator (AO) sits at 1042.76, indicating positive momentum.
Market Phase: Momentum Breakout
Phemex Exclusive Data: 66% Long Bias in Contract Markets
While spot charts show the path already traveled, the order book and Sentiment gauges offer insight into future positioning. To understand the "why" behind this recovery, we must examine the real-time sentiment data provided by Phemex’s contract trading activity.
The current Phemex BTCUSDT perpetual contract data reveals a sentiment shift that market participants should monitor closely:
Buy Orders (Longs): 66%
Sell Orders (Shorts): 34%
Interpreting the 66% Long/Short Ratio
A 66% long-bias indicates that two-thirds of the active capital on Phemex's futures platform is currently positioned for potential upside. This reflects significant activity, including large-scale orders—often referred to as "whale" activity—concentrating to create substantial Buy Walls.
On the Phemex contract interface, this Buy Wall is currently concentrated around the $68,058 mark. In market mechanics, a Buy Wall acts as a technical floor. As long as the price maintains its position above this liquidity zone, the technical "path of least resistance" appears to be upward. For traders on Phemex, this data suggests that minor pullbacks toward the $68K range are currently meeting aggressive buying interest.
The Contrarian Perspective:
It is important to note that a high Long/Short ratio can occasionally precede a long squeeze if the market becomes over-leveraged. However, today’s data shows that the volume (3.13K BTC in spot) and the Accumulation/Distribution indicator (3.083K) suggest this move is backed by genuine market demand rather than purely speculative leverage.
Technical Setup: Key Support and Resistance Levels
Based on the Phemex Daily Chart, the roadmap for the coming days involves two primary technical boundaries. Navigating these levels requires a disciplined approach to risk management.
1. The Support: 7-Day Moving Average (MA 7 - $66,923.88)
The 7-day Moving Average (MA 7) is the pulse of short-term momentum. Currently sitting at $66,923.88 on the spot market, this line is curling upward at a sharp angle.
Significance: The MA 7 is acting as the primary dynamic support. In a trending market, the price often uses the MA 7 as a springboard for further expansion.
Risk Management: For trend followers, $66,923 is a critical "line in the sand." If a daily candle closes below this level, it may indicate a "fake-out" or a potential shift back to a consolidation phase. Maintaining a position above this level is key for the current trend's health.
2. The Resistance: 30-Day Moving Average (MA 30 - $71,095.86)
A look at the purple line on the Phemex chart reveals the 30-day Moving Average (MA 30), looming at $71,095.86. This is a major technical hurdle.
Significance: The MA 30 represents the average price over the last month. Since Bitcoin has recently traded below this level, it now functions as a ceiling of overhead resistance.
The Breakout Trigger: A clear daily candle close above $71,100 would serve as a technical confirmation that the previous correction has likely concluded. Such a move historically attracts sidelined capital looking for trend confirmation.
The 2026 Macro Context: Fundamental Drivers
To understand why Bitcoin is reclaiming $68K on February 26, 2026, we must consider the broader economic environment.
Institutional Supply Dynamics: With the 2024 Halving well in the past and institutional ETFs (Exchange Traded Funds) continuing to absorb daily production, the "supply shock" is a persistent theme in 2026.
Monetary Policy Shift: As global central banks navigate the economic landscape of 2026, Bitcoin’s role as a decentralized digital asset becomes increasingly relevant for portfolio diversification.
The Phemex Advantage: In a high-speed market, real-time data is a vital tool. The ability for traders to monitor order book imbalances and the Awesome Oscillator (AO) on Phemex provides a data-driven edge over lagging indicators.
Market Scenarios: Tactical Monitoring
The technical signal suggests that volatility has returned. Based on the data from the Phemex Trading Engine, here are two primary scenarios for traders to monitor.
Scenario A: Bullish Continuation (Support Retention)
If Bitcoin maintains its foothold above $68,000, the momentum may carry it toward the psychological barrier of $70,000.
Levels to Watch: Current support at $68,058 (Buy Wall) and $68,117.
Primary Target: $69,973 (The recent 24h high).
Secondary Target: $71,095 (The MA 30 resistance).
Invalidation Level: A drop below $66,850 (MA 7).
Scenario B: Bearish Rejection (Resistance Failure)
No market move is guaranteed. If Bitcoin fails to sustain the $68,000 level due to macro-economic shifts or localized profit-taking, a retracement may occur.
Levels to Watch: A 4-hour candle close below $67,900.
Downside Target: A retest of the MA 14 ($67,558) or the MA 7 support at $66,923.
Risk Management: Monitoring the $68,500 zone for potential rejection signs.
Pro-Tip: Leveraging Phemex Tools for Risk Management
To navigate the $68K reclaim effectively, participants should utilize the sophisticated tools available on the Phemex platform:
Trailing Stop Orders: As BTC approaches the $71K resistance, trailing stops can help lock in profits while allowing for further upside if the resistance is breached.
Leverage Management: In a 3.45% volatility environment, users should ensure their liquidation prices are positioned safely below the $64,758 support floor to account for potential "wicks."
Real-Time Sentiment Monitoring: Keep the Phemex sentiment gauge open. If the "Buy Orders" percentage starts to decrease from 66% toward the 50% equilibrium, it may indicate the rally is losing momentum.
Final Thoughts: Monitoring the Trend
As of February 26, 2026, Bitcoin sits at a technical crossroads. The successful defense of the $64.7K level and the subsequent reclaim of $68K suggest a shift in market dynamics.
The 66% long sentiment on Phemex reflects a collective outlook among a global community of traders. Whether you are a short-term trader targeting the $70K range or a long-term investor watching for a $71K breakout, current market conditions require both vigilance and disciplined execution.
The resistance at $71,095 remains the definitive "Boss Level." A breach of this zone would mark a significant technical milestone for the 2026 market cycle.Are you positioned for the next move?
Monitor BTC/USDT Markets on Phemex Now
Disclaimer: This article is for informational purposes only and is based on real-time market data from the Phemex Trading Engine. Cryptocurrency trading involves significant risk, and market conditions can change in seconds. This does not constitute financial or investment advice. Always perform your own due diligence and never trade more than you can afford to lose. Trade responsibly.