
Summary
-
A buy wall is a massive buy order, or cumulation of buy orders, at a particular price level.
-
A sell wall refers to a large massive sell order, or cumulation of sell orders, at a particular price level.
-
Both buy walls and sell walls can be manipulated by whales — traders who own a large portion of the cryptocurrency or stocks available.

What is a Wall in Crypto?
Experienced traders are likely to have heard of buy walls and sell walls, which can be identified as price points where there are large volumes of buy orders or sell orders set respectively. Visually, the volume of orders forms a “wall” when graphed against the price points.
Buy walls and sell walls can greatly influence price fluctuations in cryptocurrency and stock markets. Understanding them can be advantageous when trading cryptocurrencies such as Bitcoin and Ethereum because it allows you to better predict price changes and set your limit orders accordingly. However, it is crucial to understand the reason behind buy walls and sell walls as they can sometimes be a form of market manipulation instead of reflecting true trading sentiment.
What is a Buy Wall?

Buy walls in green and sell walls in red from a Bitcoin example. Source: Phemex
A buy wall is a massive buy order, or cumulation of buy orders, at a particular price level. The volume of these buy orders is large enough to drive the price of the asset up if the trades are fulfilled. In fact, the presence of the buy wall tends to drive prices up even before the buy wall orders are fulfilled. This is because the asset’s supply will be significantly reduced after the price hits the buy wall. The buy wall also reflects market confidence that the price level will be significantly higher than the price of the buy wall.
How do I find walls to buy?
As such, traders respond by setting their buy orders even higher than the buy wall to get their hands on the cryptocurrency or stock and to get in on potential profits before the assets are scooped up. This drives prices up even further.
However, it is important to note that buy walls often do not reflect true market sentiment. Small buy walls tend to occur at round numbers due to psychological preferences. This is noted by many traders, who respond by pricing their buy orders just 0.1 or 0.01 cents higher than the buy wall.
Buy walls can also be artificially created. Since buy orders are dynamic and can be added or removed continuously, buy walls can be used as a form of market manipulation and may not represent true interest to buy the cryptocurrency at that price.
What is a Sell Wall?
A sell wall is the opposite of a buy wall. It refers to a large massive sell order, or cumulation of sell orders, at a particular price level, and is also frequently seen in cryptocurrency trading.
A sell wall can cause the price of a cryptocurrency to drop. This is because a sell wall indicates that there will be a surge in the supply of the cryptocurrency at that price. This will overwhelm demand and drive prices down.
How do I find walls to sell?
Traders who wish to sell off their cryptocurrency are aware of the fact that if they set their prices above the sell wall, the asset may never hit their order price. Thus, they pre-emptively set their sell orders below the wall.
This drives prices down further, as more and more traders set sell orders below the sell wall. Thus, the cryptocurrency meets with great resistance at that price range and will be kept at a low price.
However, similar to buy walls, sell walls can be manipulated by whales — traders who own a large portion of the cryptocurrency or stocks available.
Psychology of Buy and Sell Walls
Buy and sell walls significantly influence market psychology and can be used intentionally to sway sentiment. A massive buy wall often instills bullish confidence, leading traders to buy above it, driving prices up and creating a self-fulfilling support level. Conversely, a prominent sell wall can discourage buying, as traders may infer it indicates a good price to sell, creating psychological resistance.
Whales (large traders or institutions) are aware of these psychological effects and may manipulate perception. For example, they might create a buy wall to pump prices and then retract it, or establish a sell wall to scare the market before buying cheaper. This type of order book manipulation, known as spoofing, is more common in less liquid markets and remains prevalent in crypto.
Additionally, human psychology influences trading at round numbers, leading to clusters of orders that resemble walls. Some traders strategically place orders just above or below these numbers to avoid competition, causing mini walls that may not reflect genuine support or resistance. Thus, walls at odd prices might indicate stronger, deliberate trading activity compared to those at round figures.
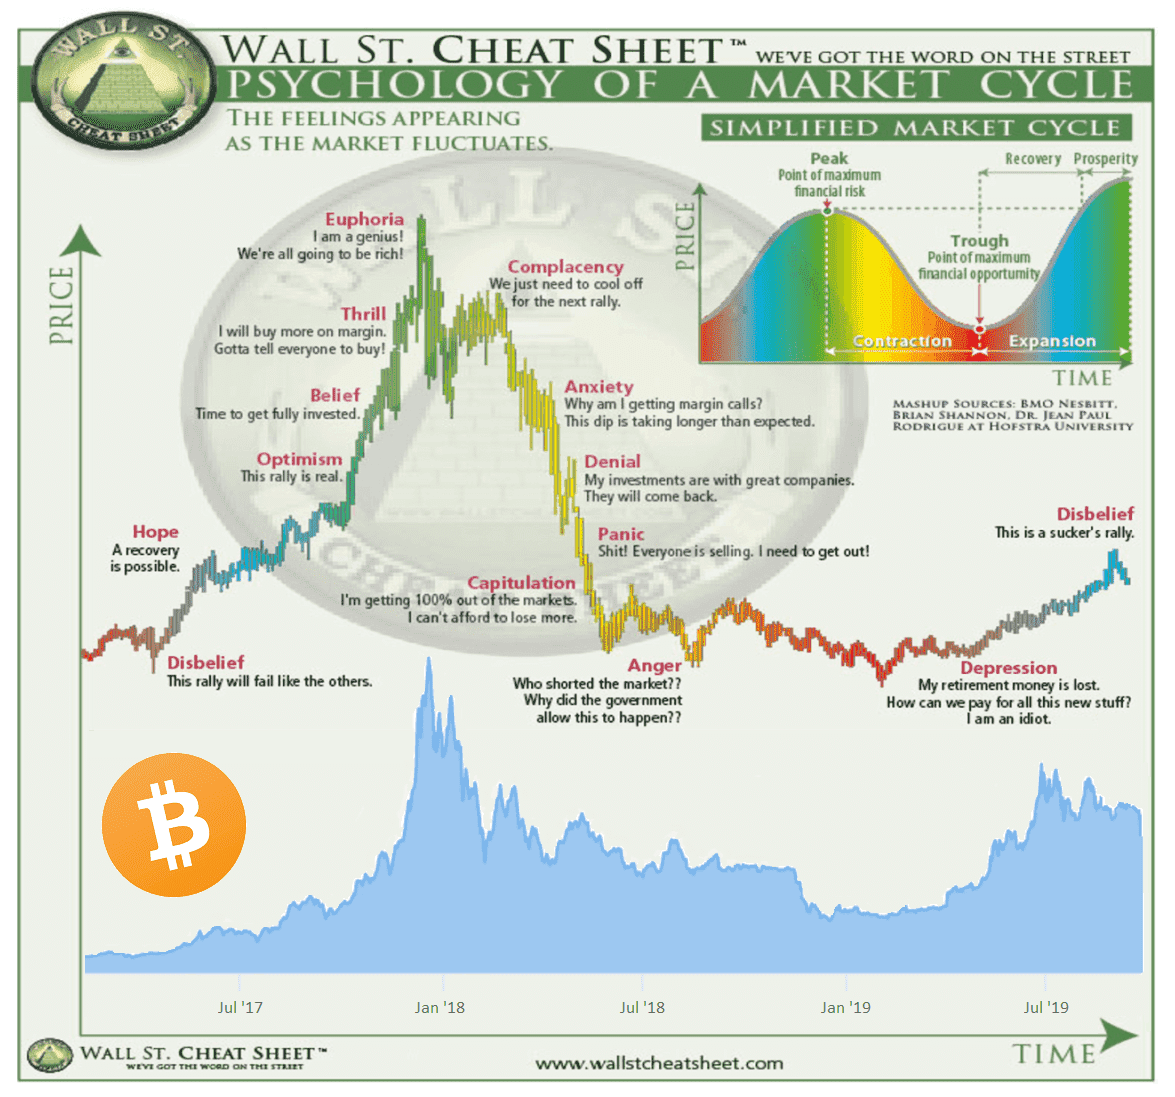
Market Cycle Psychology
Identifying Buy Walls and Sell Walls
What is an Order Book?
In order to identify buy and sell walls on a real cryptocurrency exchange, a trader must first understand how to read an order book.
An order book is “an electronic list of buy and sell orders for a specific security or financial instrument, organized by price level. An order book lists the number of shares being bid or offered at each price point.” Order books are dynamic and constantly updated in real-time. They consist of unfulfilled buy orders, sell orders, and market order history.
In any order book, you will see the terms “bid” and “ask”. A bid is an order to buy, while an ask is an order to sell.
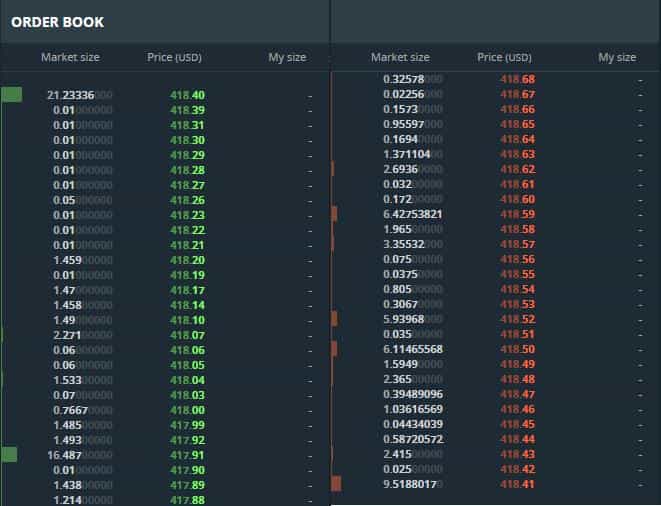
Example of an order book. Source: Medium
When the price points of a bid and an ask match, the exchange makes the trade. The occurrence of these trades in turn influences the price of the asset. For instance, if there is high demand for a cryptocurrency and buyers are willing to pay a high price for it, they may keep increasing their bid prices until they match the asking price of the sellers. When such trades take place, the price of the cryptocurrency or stock is driven up.
While order books are meant to help traders make more informed decisions, this market information can oftentimes be influenced by large players who wish to manipulate market sentiment.
How do I read a Depth Chart to Identify Buy Walls and Sell Walls?
A depth chart is a tool for understanding the supply and demand of a cryptocurrency at any moment (for a range of prices). It is a more visual graph that represents the information in the order book.
A depth chart consists of several key components:
-
Bid Line– The bid line displays the cumulative value of the buy orders, or demand, at any given price point. This is represented by a green line on the left side of the chart.
-
Ask Line– The ask line shows the cumulative value of the sell orders, or supply, at any given price point. This is depicted by a red line on the right side of the chart.
-
X-Axis– The horizontal axis is usually in dollars. It shows the different price points at which buy and sell orders are being placed.
-
Y-Axis– The vertical axis is typically in the cryptocurrency that you are trading, for example, Bitcoin. It represents the quantity of orders being placed at each price point.
Typically, a trader is able to hover their mouse over the bid and ask lines to view the number of purchase or sell orders at each price point easily without having to eyeball the axes.
In the case of buy and sell walls, you would see significantly deeper vertical lines resembling the sides of a staircase in the depth chart, as seen in the example below.
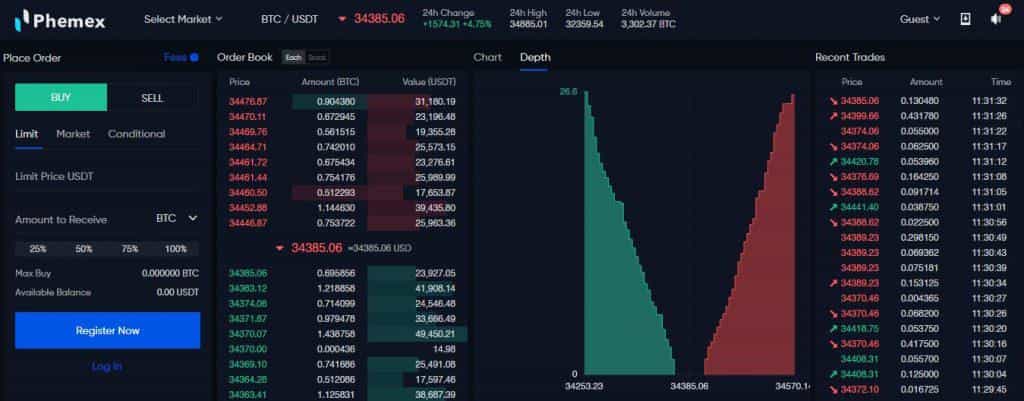
Example for reading depth charts. Source: Phemex
What is A Whale Wall?
What is a Whale and How do they Carry Out Order Book Manipulation?
As explained briefly above, a whale is a person or institution that holds significant amounts of a cryptocurrency or other asset. This gives them an inordinate amount of power to impact market prices through their actions.
Some examples of whales in the Bitcoin industry include Bitcoin founder Satoshi Nakamoto, Gemini exchange co-founders Tyler and Cameron Winklevoss, and Tesla. If Tesla were to sell all of its Bitcoin, for instance, the price of the cryptocurrency would surely plummet due to the sheer volume and over-supply of Bitcoin that is suddenly released to the market.
Additionally, such actions tend to influence public sentiment on the health and growth potential of the cryptocurrency, thus leading to further sell-offs.
This is why many experts warn that buy and sell walls are often artificially created. Whales have the resources to single-handedly create buy and sell walls by setting a high number of buy or sell orders. Some whales intentionally do so to sway market sentiment and manipulate prices for their own gain. This is called a whale trading strategy.
Hence, buy and sell walls may not always be a meaningful estimate of public sentiment for a cryptocurrency company or product. Traders should thus take note not to overly rely on buy and sell walls when making their trading decisions.
How can I tell if the Cryptocurrency Market is being Manipulated?
Is the Buy or Sell Wall real?
However, one way you can determine if the buy or sell wall is real is by keeping up to date with the latest news in cryptocurrency. In the case where there appears to be significant buy walls or sell walls against the backdrop of little change in public sentiment on social media and in the news, that may be an instance of market manipulation.
Another important concept that could help you evaluate the potential impact of buy or sell walls, and the possibility of market manipulation, is market depth.
How to use the market depth to evaluate a buy/sell wall?
Market depth refers to the “market liquidity of an asset based on the number of standing orders to buy and sell at various price levels.”
Market depth is considered to be high when there are high volumes of pending orders on both the bid and ask side. This means that prices are less easily manipulated by large market orders at any particular price, since these are absorbed into the large volume of overall orders. It is thus less likely for the buy and sell walls to have a huge influence on the prices, and traders need to pay less heed to them in such cases.
However, at the end of the day, there is no fixed guideline in determining whether a buy wall or sell wall is real, and much of it relies on your own discernment.
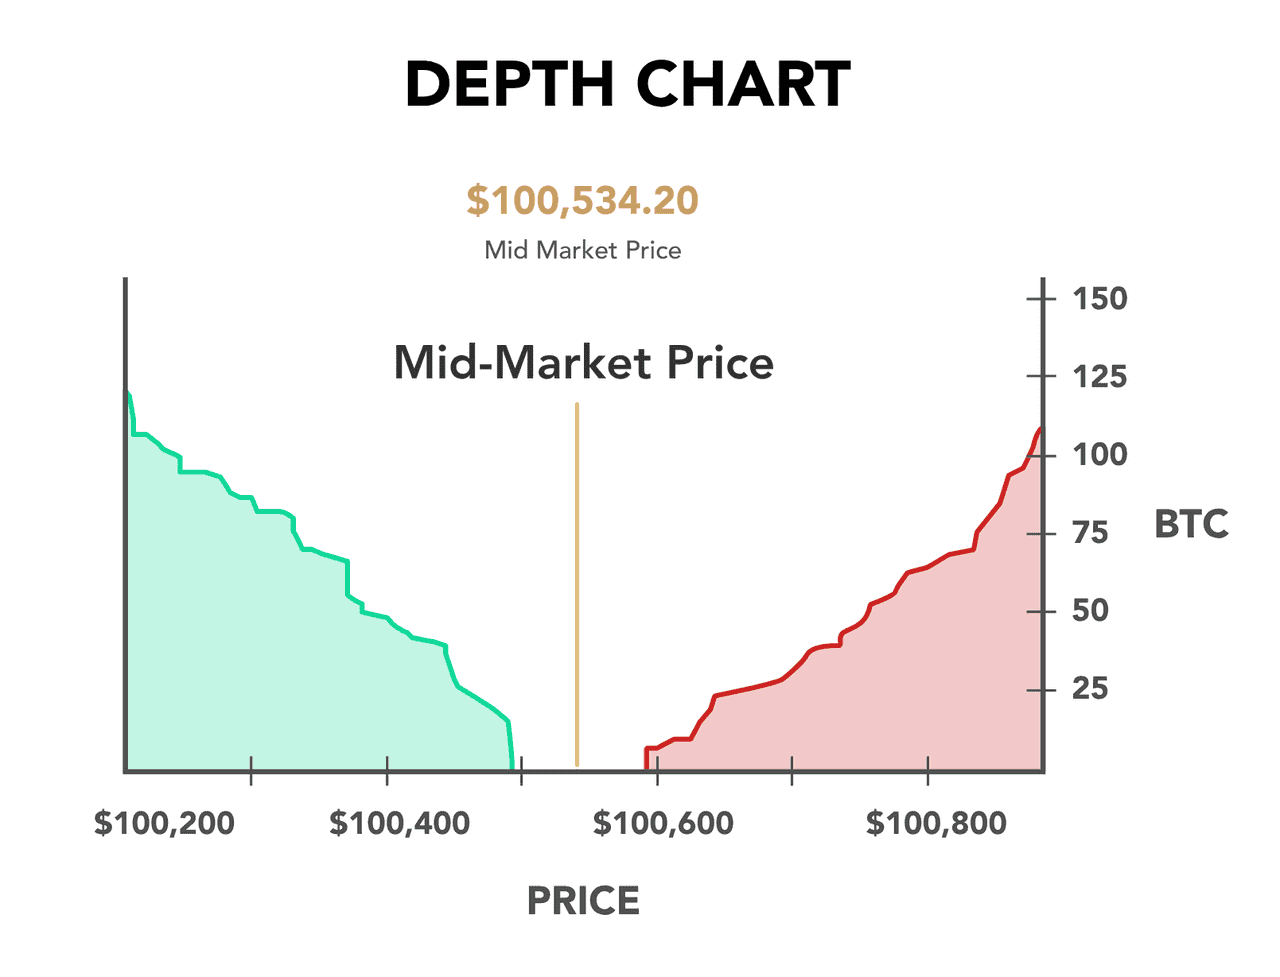
Midmarket Price via Depth Chart (source)
Limitations of Buy and Sell Walls
While buy and sell walls can provide valuable insights, they aren't foolproof. Walls can disappear suddenly, as they depend on individual traders' or algorithms' intentions. If you base your strategy on a wall that vanishes, the market can move quickly against you, emphasizing the importance of risk management like stop-losses.
In thicker, more liquid markets (e.g., BTC/USDT), a single wall might not significantly impact prices, while in thinner markets (like small-cap altcoins), a wall can be easily manipulated. As crypto markets mature, what was once a large wall may become relatively insignificant. Always assess the context; a 100k wall may be substantial for an altcoin but negligible for Bitcoin.
Be especially cautious during major news events or pump-and-dump scenarios, where walls can collapse under sudden market orders. In such situations, emotions often outweigh technical indicators. Additionally, remember that market depth may reveal more orders just beyond what you see, which can be crucial for understanding true interest levels.
In summary, don't rely solely on buy/sell walls for your trading strategy. Use them as one tool among many, remain flexible, and always protect yourself with a solid risk management plan. Experience will help you distinguish between genuine demand and market manipulation.
Conclusion
The cryptocurrency markets are characterized by both high risks and high returns. Profitable trades can earn you huge rewards that easily supersede the stock markets. However, the unpredictable and highly speculative nature of trading cryptocurrencies lends itself to market manipulation. This is especially the case when market depth is low and a single whale or group of whales can cause significant price shifts. Learning more about technical analysis and staying updated on the latest developments in the cryptocurrency markets can help you discern the right opportunities and trading strategies amidst volatility.
To trade effectively using insights about buy and sell walls, you’ll want a reliable and advanced trading platform. Phemex is an excellent choice for executing these tactics in real-time. As a leading crypto exchange, Phemex offers deep liquidity on major trading pairs, meaning large orders (and walls) are clearly visible and the markets are efficient. The platform’s interface includes an easy-to-read order book and depth chart, so you can monitor those buy and sell walls as you strategize. Whether you’re trading spot or using Phemex Futures for leveraged positions, the responsiveness and stability of the exchange are critical when you’re timing entries/exits around fast-moving order book events. Phemex also provides advanced trading tools and bots that can help automate your strategy.