Market Alert: "Extreme Fear" (11) & The Mechanics of High-Volume Capitulation
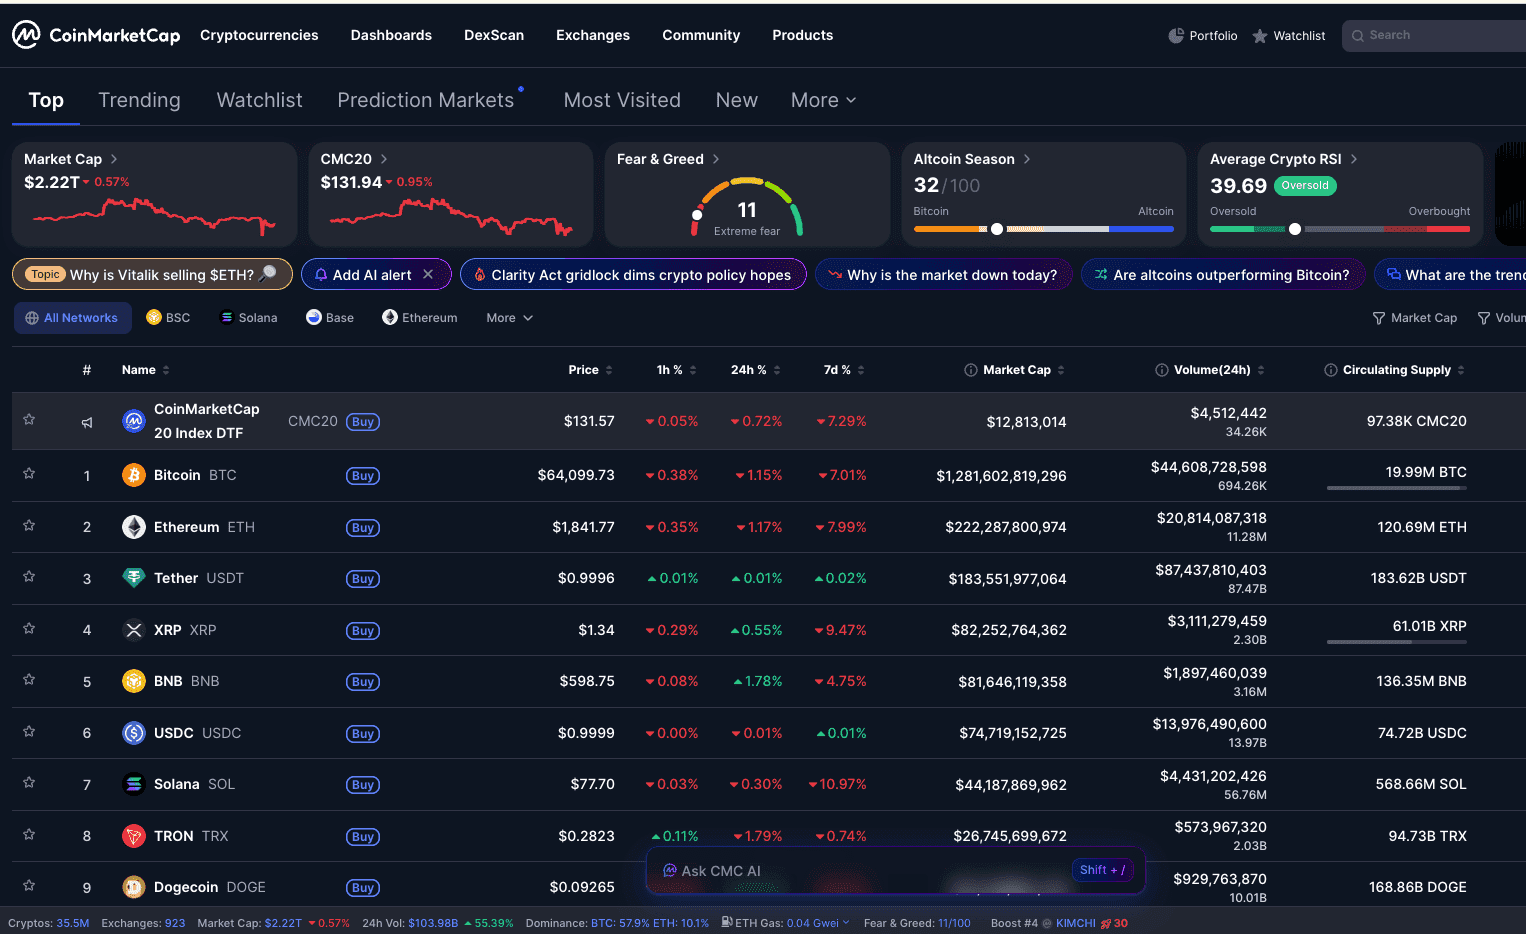
The digital asset landscape is undergoing a period of intense price discovery during the session for crypto trading Feb 24. Market participants are currently navigating a high-velocity "de-risking" event, as evidenced by the Crypto Fear & Greed Index crashing to a reading of 11 (Extreme Fear). This represents one of the lowest sentiment readings in recent years, historically appearing only during major structural market shifts.
As of this morning, the total crypto market capitalization has adjusted to 103.98 billion. In technical terms, this indicates a "Capitulation Event"—a scenario where high selling pressure is met by significant liquidity flush in the order books. This turnover of supply from "weak hands" to long-term institutional interest is a critical phase of any market cycle.
Two primary external catalysts are currently driving this sentiment: the legislative gridlock surrounding the "Clarity Act" in Washington, and localized rumors regarding treasury movements, often referred to as the "Vitalik selling $ETH" narrative. Below, we break down the technical implications for the industry’s top assets.
0-4h Window: The "Volume Spike" Anomaly
In a standard bearish trend, prices often "bleed" on low volume. Today, we are seeing the opposite. The spike in activity suggests that we are witnessing a "liquidity flush" of leveraged positions.
Bitcoin (BTC) Volume ($44.55B): A 58.37% increase, indicating that the Bitcoin price today is being heavily contested at macro support levels.
Ethereum (ETH) Volume ($20.78B): A 54.78% increase, reflecting a surge in activity as participants monitor the Ethereum live chart for a potential floor.
Solana (SOL) Volume ($4.42B): A 57.09% increase as the asset retraces toward early 2024 accumulation zones.
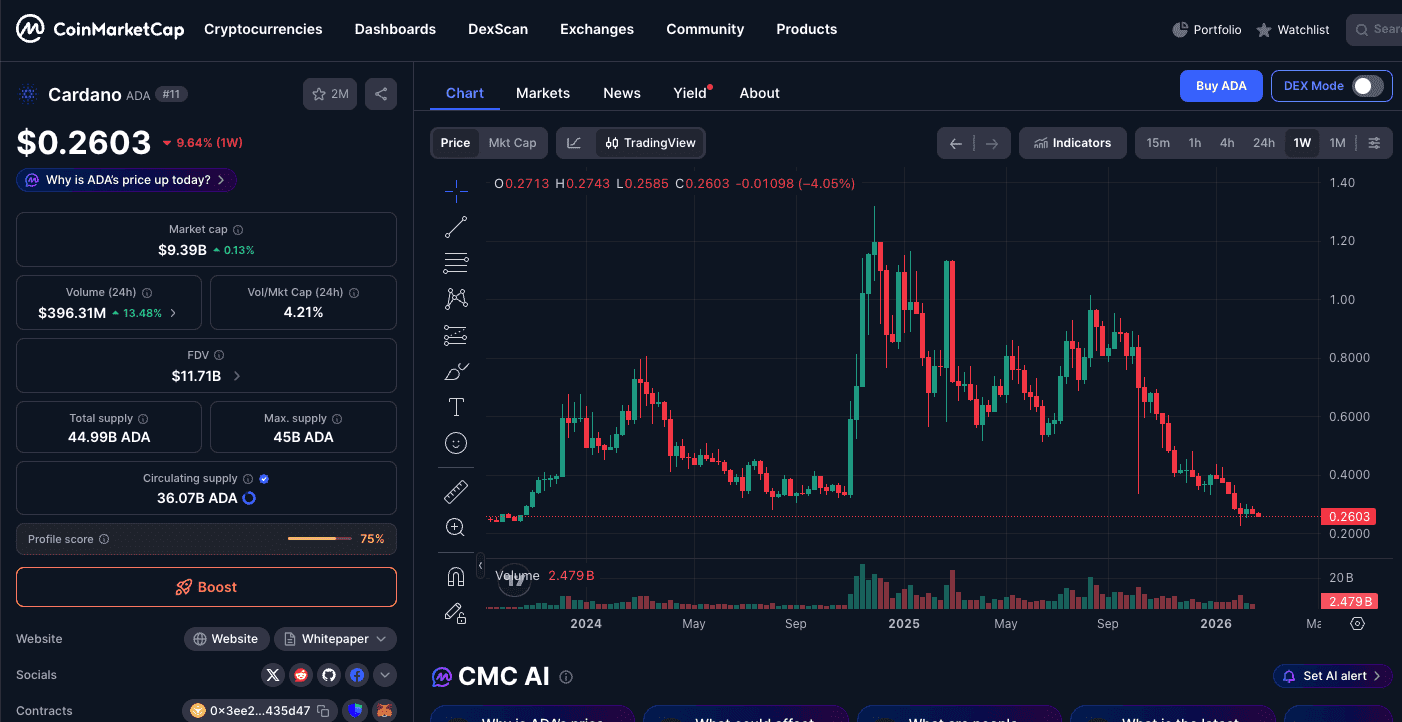
Cardano (ADA) Volume ($396.31M): A 13.48% increase, bringing a spotlight to the latest Cardano ADA news.
Phemex Technical Insight: When volume expands by more than 50% while prices hit new local lows, it typically signals "exhaustion." This does not guarantee an immediate reversal, but it suggests that the majority of panic-induced selling may have already occurred, leading into a period of consolidation.
Deep Dive: Real-Time Technical Analysis
Data Snapshot as of Feb 24, 2026
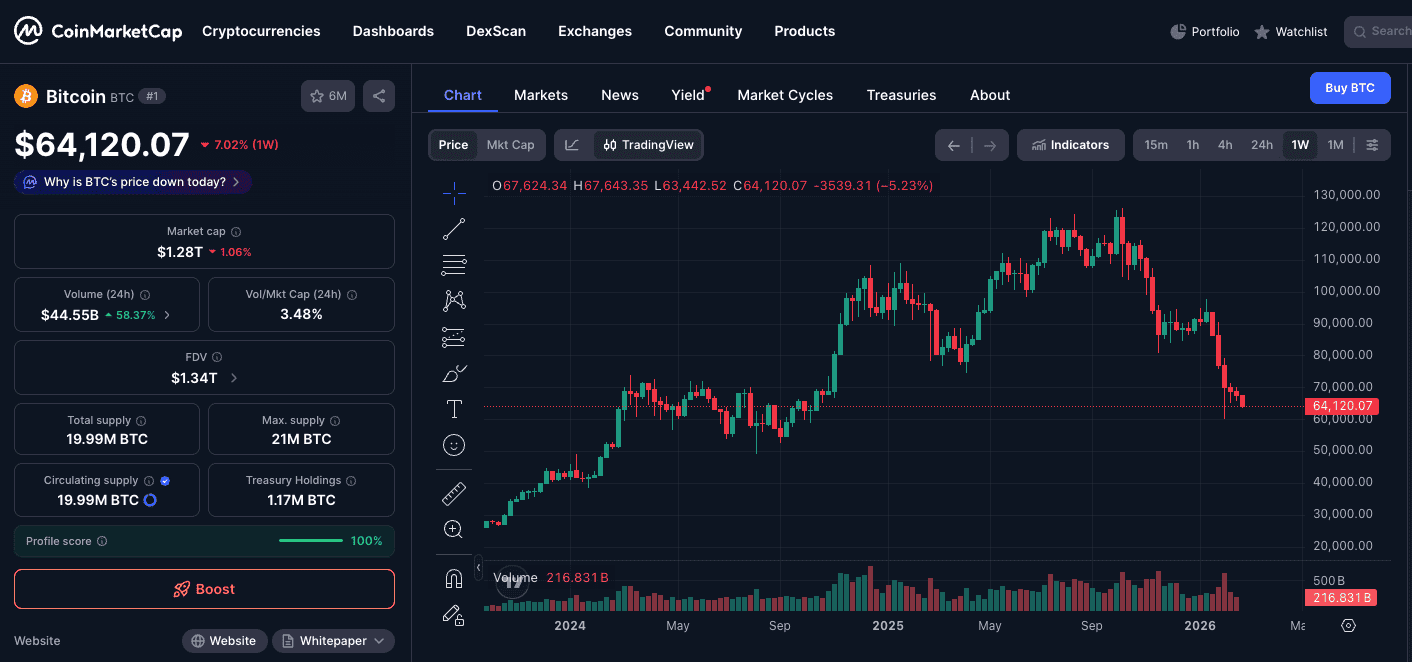
1. Bitcoin (BTC): The Struggle for the $64,000 Threshold
The Bitcoin price today stands at $64,120.07, struggling to maintain its footing after a 7.02% decline over the past week.
Market Structure: On the weekly timeframe, Bitcoin is currently testing the "neckline" of a distribution phase that began in late 2025. This $64,000 zone is psychologically and technically significant; it served as a major resistance-turned-support level throughout mid-2024.
Candlestick Observations: The 4-hour chart shows long lower wicks reaching down to $63,442. These "wicks" represent aggressive buying at lower levels, suggesting that institutional "buy walls" are active just below the $64k mark.
Volatility Outlook: Should BTC fail to hold $64,000 on a daily closing basis, the next major liquidity cluster sits at the $60,000 psychological support.
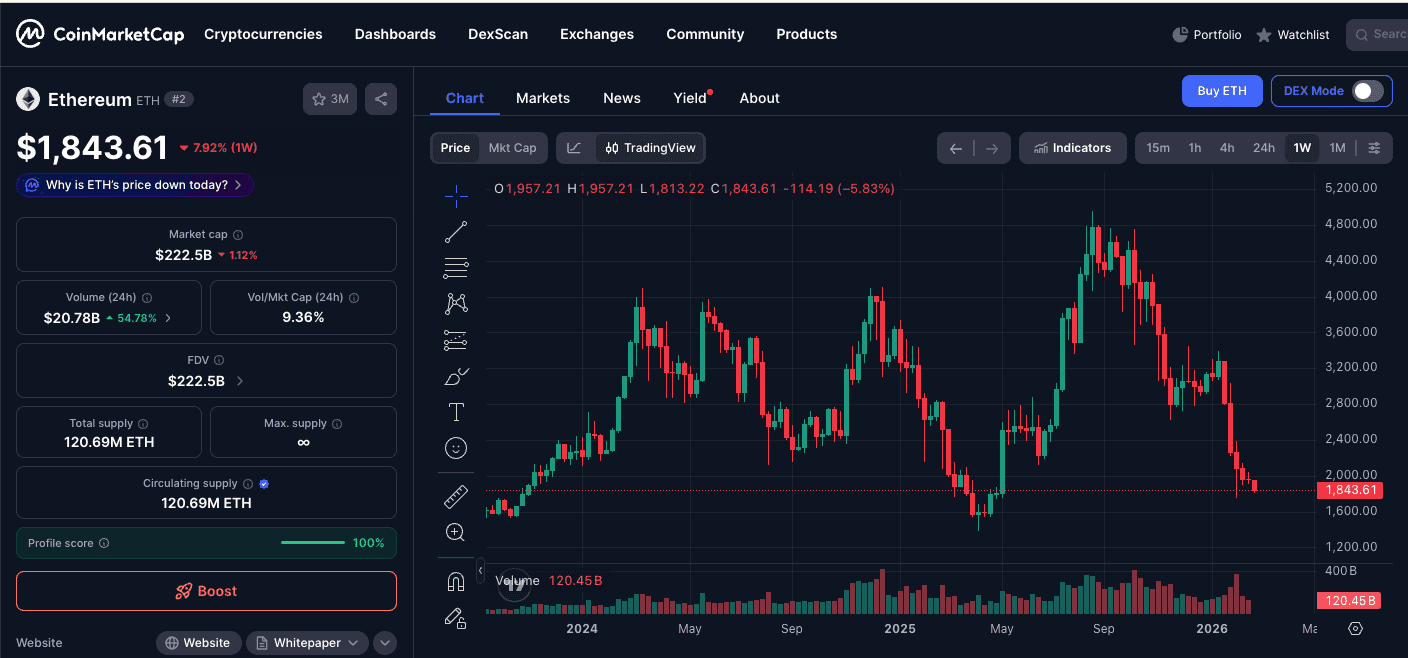
2. Ethereum (ETH): Distribution Pressure & The Ethereum Live Chart
The Ethereum live chart currently displays a price of $1,843.61, marking a 7.92% retracement over the last seven days.
Sentiment Drag: The ETH market is currently reacting to a combination of regulatory uncertainty (the Clarity Act) and social media-driven rumors. Technically, ETH has moved below its 50-day and 200-day Moving Averages, placing it in a "bearish cross" territory.
RSI Divergence: Despite the price drop, the Relative Strength Index (RSI) is hitting deeply oversold levels (below 30). Historically, when ETH is this oversold on high volume, a "dead cat bounce" or a relief rally toward $1,920 often follows, though the long-term trend remains cautious.
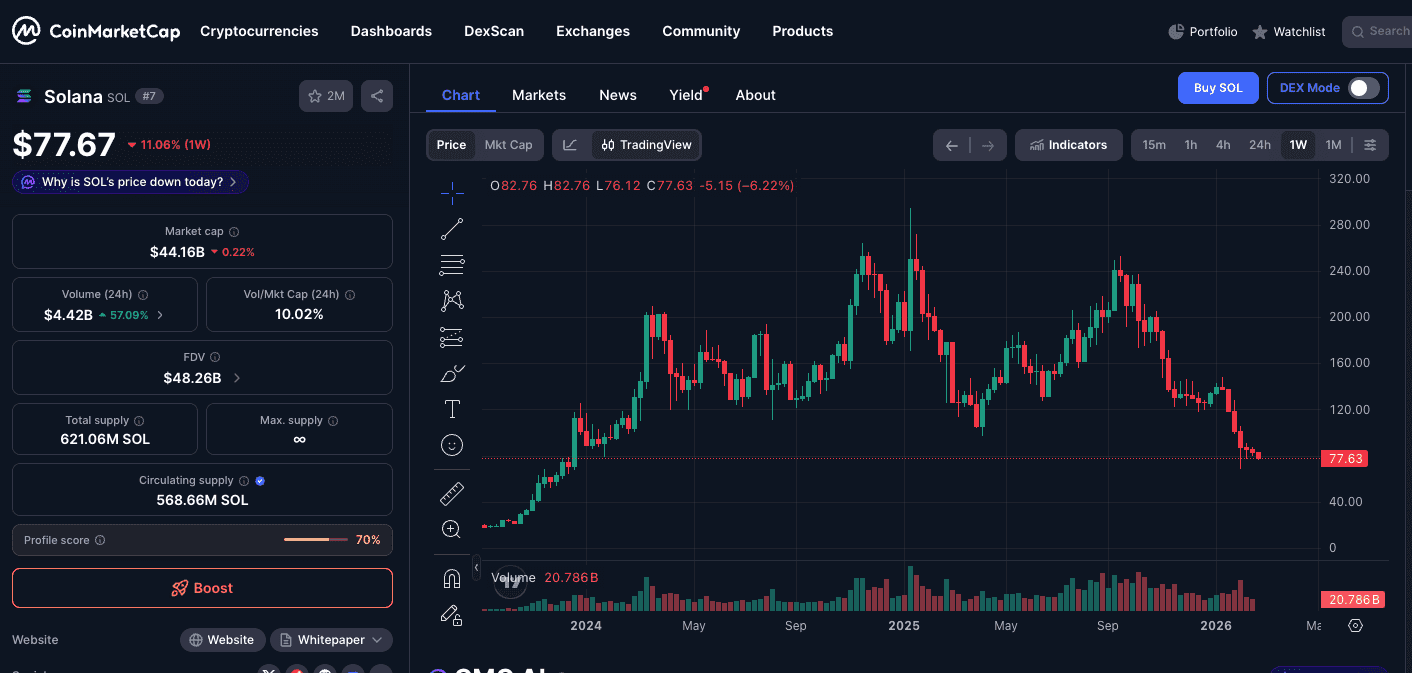
3. Solana (SOL): Returning to Historical Accumulation
Solana has experienced a sharper adjustment than its peers, currently trading at $77.67, down 11.06% on the weekly chart.
The Technical Pattern: The SOL chart shows a completion of a large-scale Head and Shoulders pattern. The current price level of $77 represents a return to the early 2024 accumulation range.
Opportunity Analysis: As a high-beta asset, SOL typically leads both the market’s descent and its recovery. Traders often look for stabilization in SOL as a leading indicator for the broader altcoin market.
4. Cardano (ADA): Sifting Through the Cardano ADA News
The latest Cardano ADA news indicates that the asset is testing its multi-year support baseline at $0.2603.
Resilience Factors: Despite the 9.64% weekly decline, ADA’s market cap remains stable at $9.39B. The asset is currently in a "value zone" for long-term holders, with the price interacting with support levels not seen since the previous market cycle.
Critical Levels: A daily close above $0.27 would be a constructive signal for ADA, whereas a break below $0.24 could lead to a deeper search for liquidity.
Tactical Navigation: Market Scenarios for Crypto Trading Feb 24
In an environment of "Extreme Fear," tactical discipline is more important than speculative momentum. Here are the three technical scenarios the Phemex Research Team is monitoring for the remainder of the session:
Scenario A: The "Swing Failure Pattern" (BTC)
If the Bitcoin price today dips below the recent low of $63,440 and then quickly reclaims the $64,120 level, it could indicate a ["liquidity grab."
This is often a precursor to a relief rally as short-sellers are forced to cover their positions.
Scenario B: The "Resistance Flip" (ETH)
By analyzing the Ethereum live chart, we see heavy overhead supply at $1,900 - $1,925. Until ETH can reclaim this zone on high volume, any upward movement is likely to be viewed by the market as a ["sell-the-bounce" opportunity.
Scenario C: Altcoin Stabilization (ADA)
Following the latest Cardano ADA news, we are looking for a decrease in selling volume. If ADA can consolidate between $0.25 and $0.27 while the Bitcoin Fear & Greed Index remains low, it may signal that the "bottom" is being formed through accumulation.
Risk Management: Why Sophisticated Traders Choose Phemex
During periods of 11/100 Fear, the ability to manage risk is what separates successful traders from the rest. For those looking to buy crypto, Phemex offers a comprehensive ecosystem designed for volatility protection:
Hedge Mode: This essential tool allows you to hold a Long and a Short position on the same contract simultaneously. In the current crypto trading Feb 24 environment, you could hedge your long-term Bitcoin holdings with a short-term tactical short to neutralize market delta.
Advanced Liquidity: With $103B in global volume, Phemex ensures that your orders are executed with minimal slippage, even during "Extreme Fear" events.
Real-Time Data Feeds: Access an Ethereum live chart with institutional-grade indicators to stay ahead of the "Vitalik selling" rumors and other market-moving news.
Security of Assets: Phemex utilizes hierarchical deterministic cold wallet systems, ensuring that even during market "crashes," your underlying capital remains secure.
Conclusion: The market is currently in a high-stress phase of the 2026 cycle. While "Extreme Fear" can be intimidating, it is also the period where the most significant technical levels are established.
Monitor the charts. Manage your leverage. Trade on Phemex.
Disclaimer: The technical data provided (BTC at $64,120, ETH at $1,843, SOL at $77.67, ADA at $0.26) is a snapshot as of Feb 24, 2026. Digital asset trading involves significant risk and is not suitable for all investors. This report is for informational purposes and does not constitute financial, investment, or legal advice. Always conduct your own thorough research (DYOR) before committing capital.