


Introduction
The Connors Relative Strength Index (CRSI) is a momentum oscillator designed specifically for short-term trading. Developed by Larry Connors and his team, it modifies the classic 14-day RSI to better cater to fast-moving markets, enabling crypto traders to identify extreme conditions more swiftly. The CRSI incorporates several sub-indicators, including a very short-term RSI, an up/down streak measure, and a rate-of-change component, which all contribute to a single reading.
Due to its faster-response design, the CRSI often employs more extreme thresholds compared to a standard RSI. For instance, it typically considers a market to be overbought at around 90 and oversold at around 10. In practical terms, a CRSI value below 10 indicates a deeply oversold condition and may signal a buying opportunity, while a value above 90 suggests extreme overbought conditions.
The Connors RSI is particularly useful in crypto trading as it highlights short-term momentum shifts and trader psychology. It can signal a reversal in a volatile market faster than slower oscillators, giving day traders the chance to enter or exit positions near local highs or lows. Given the frequent sharp spikes and dips in cryptocurrencies, a finely-tuned oscillator like the CRSI can assist traders in timing their trades effectively, allowing them to catch reversals or continuations earlier than traditional indicators.
What Is ‘Connors RSI’?
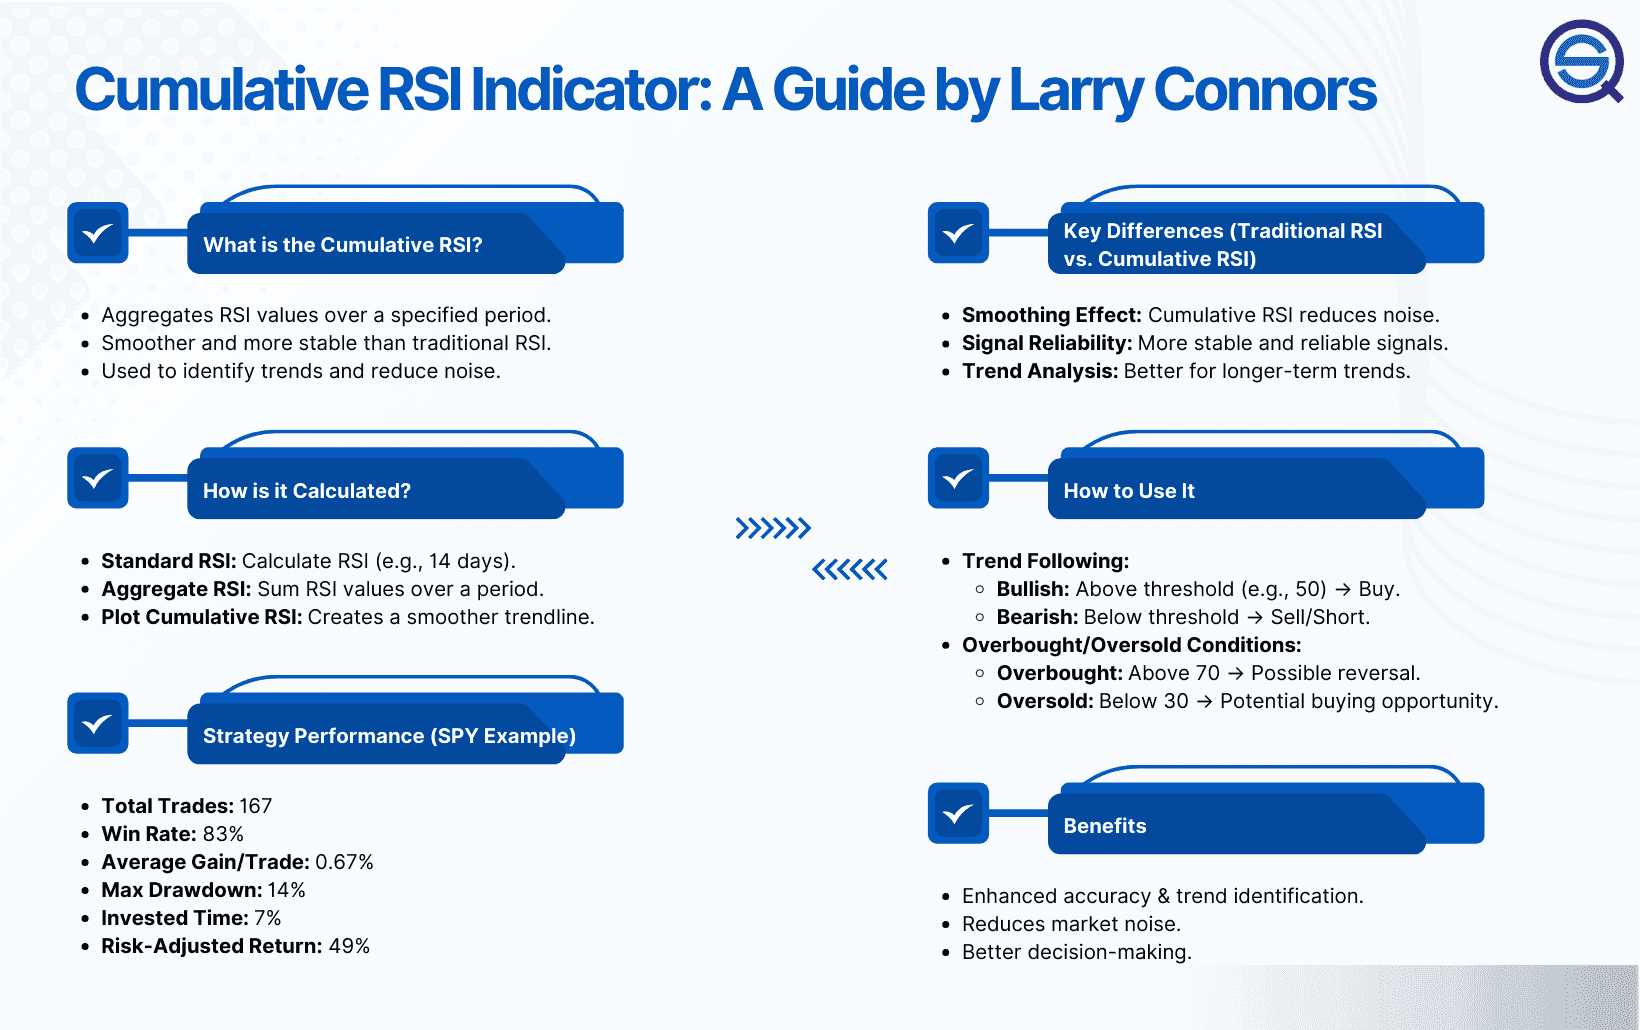
Connors RSI (CRSI) is an enhanced version of the standard Relative Strength Index (RSI), specifically designed to respond quickly to market movements. Instead of relying on a single formula, CRSI averages three components: (1) a 3-period RSI of price, (2) a 2-period RSI that measures the length of consecutive price increases or decreases, and (3) the 100-day Percent Rank of the one-day rate of change.
In practice, Connors and his team discovered that this multi-faceted approach allows CRSI to adapt better to short-term fluctuations compared to the traditional 14-day RSI. By design, CRSI reacts quickly when momentum aligns with a streak of price movements. For example, a series of strong consecutive price increases will elevate the streak component, while a sudden significant change will push the Percent Rank up—together driving the CRSI higher. Conversely, a sharp decline accompanied by a long downtrend will push CRSI towards zero, making it much more responsive to sudden price movements than the standard RSI.
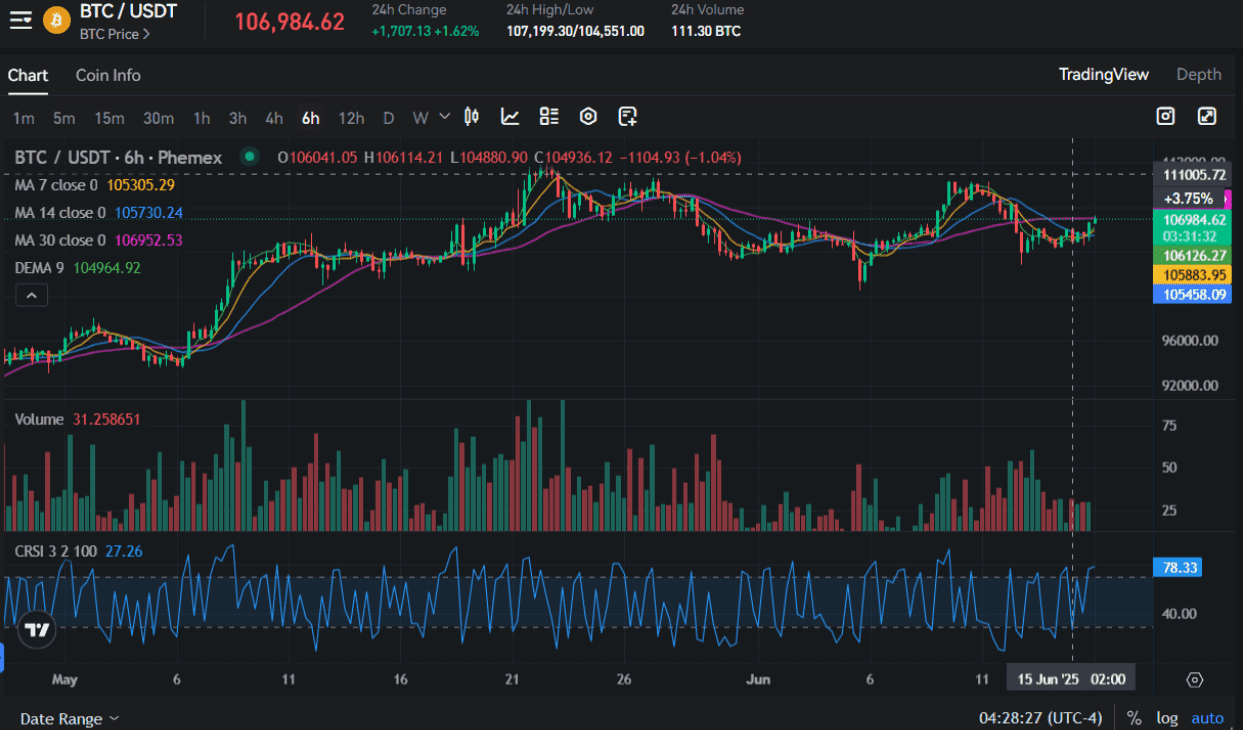
Connors RSI for Bitcoin on Phemex (source)
Psychology Behind It
At its core, Connors RSI measures trader psychology. Like the standard RSI, it captures extremes of market sentiment. When traders become overly optimistic and drive prices significantly higher, CRSI spikes towards the top (near 100), indicating extreme greed. Conversely, when fear takes hold of the market and causes prices to plummet, CRSI drops towards zero, signaling extreme pessimism.
Traders utilize CRSI to monitor these psychological extremes. A very high CRSI reading often suggests that the market is overconfident (potentially indicating a peak), while a very low reading implies excessive fear (often a sign of a bargain). As one analysis suggests, indicators like RSI and CRSI essentially communicate the "universal language of market emotions," highlighting moments of euphoria or panic. In essence, CRSI helps quantify instances when traders act irrationally, allowing others to take a contrarian approach.
How to Identify It
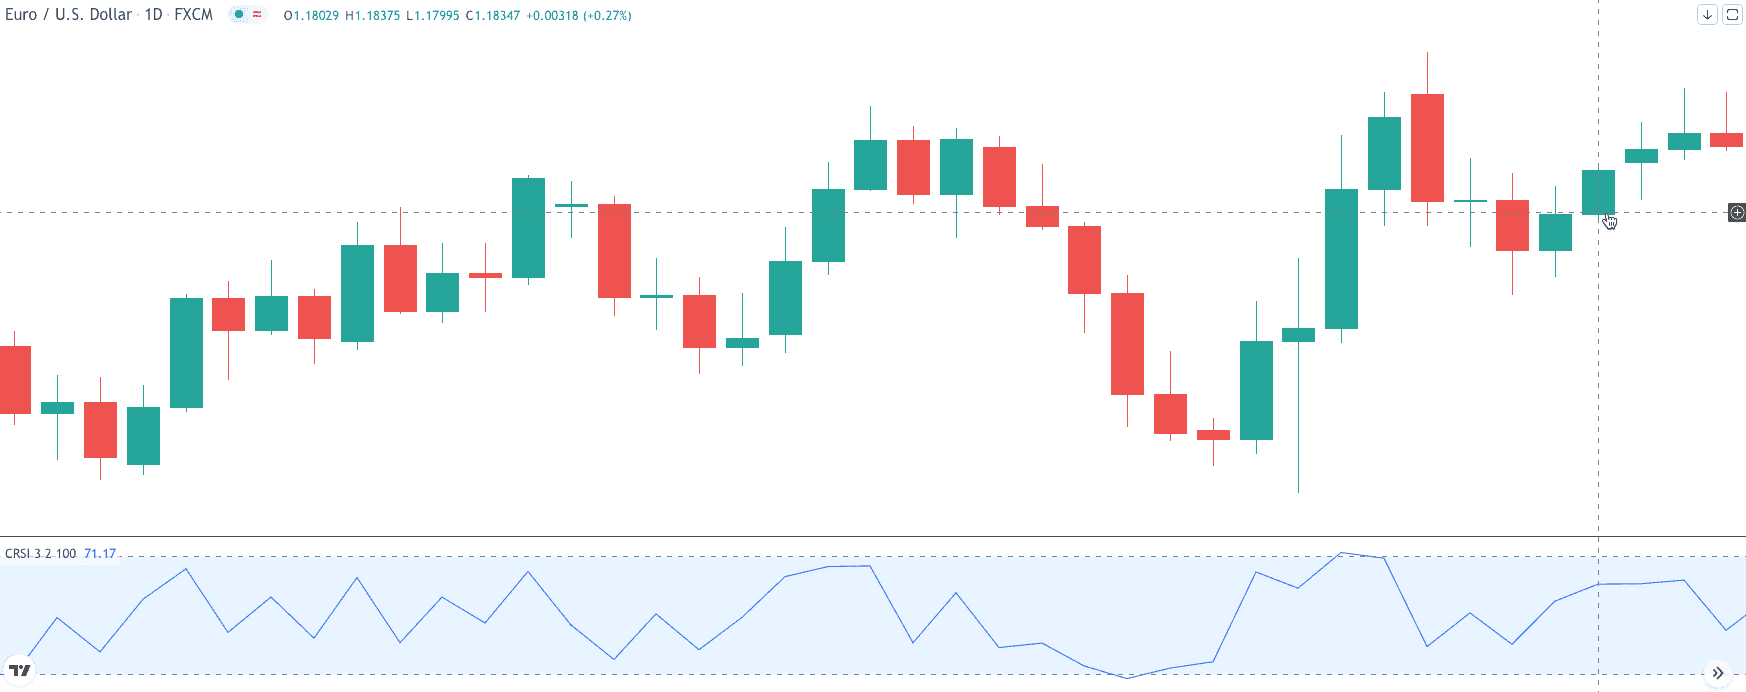
The CRSI indicator is represented as a single line that oscillates between 0 and 100 on a chart. Typically, horizontal reference lines are drawn at 90 (overbought) and 10 (oversold). To find CRSI on your trading platform, simply add it from the indicator list (on Phemex or TradingView, it is labeled “Connors RSI”). Phemex offers CRSI for free across all trading pairs. Once you have it plotted, pay attention to how the CRSI line behaves within the 0–100 range:
-
Oversold zone (buy): A CRSI reading below approximately 10 indicates extreme selling pressure. Traders look for the line to turn upwards as a potential buy signal.
-
Overbought zone (sell): A CRSI reading above approximately 90 indicates extreme buying pressure. Traders may wait for the line to turn downward from this zone as a signal to exit or short the position.
-
Neutral (hold): Values between 10 and 90 are considered normal. In an uptrend, CRSI bouncing upwards from 10 can confirm strength; in a downtrend, CRSI falling down from 90 can confirm weakness.
In summary, identifying CRSI involves observing these extreme readings. Because the indicator is highly volatile, it is often used on short timeframes. On platforms like Phemex, you will see CRSI oscillate rapidly on a 5-minute chart for cryptocurrencies. The key takeaway is that the CRSI reading reflects trader sentiment: when it approaches the extremes, the market may be poised for a reversal.
CRSI Trading (source)
How to Trade with CRSI
Traders often use the Connors RSI (CRSI) in several common strategies that typically focus on its extreme values. The main principle is to trade in the direction of the trend while using CRSI extremes to time entries and exits. Here are some strategies to consider:
-
Trend-Pullback: First, identify the trend using other methods, such as moving averages or trendlines. If the market is in an uptrend, wait for the CRSI to dip below 10 (indicating oversold conditions). When the CRSI begins to turn upward from that zone, you can enter a long position. In a downtrend, do the opposite: if the CRSI rises above 90 and then falls, that may confirm a short position. This approach helps traders find low-risk entry points in a trending market.
-
Range Bounce: In a sideways market, consider buying when the CRSI is very low and selling when it is very high. The CRSI's quick reversals can capture these price swings. However, make sure that the market is genuinely ranging; otherwise, you might be trading against a prevailing trend.
-
Breakout Confirmation: Use CRSI to validate breakouts. For example, if the CRSI is low (oversold) and the price breaks out upward through resistance, this could be a strong buy signal. Conversely, if the CRSI is high and the price breaks downward, it might indicate a strong short opportunity.
Regardless of the strategy you choose, always combine CRSI with other signals to reduce the risk of false signals. For instance, a common tactic is to look for a bullish candlestick pattern or a moving average crossover when the CRSI is in the buy zone. One effective strategy involves waiting for the CRSI to drop below 10, then watching for it to cross back above 10 alongside the formation of a bullish candle. This approach can help minimize false alarms. Similarly, an EMA cross (like EMA10 above EMA20) at the same time can increase your confidence in the trade.
When entering a trade, position your stop-loss near recent swing lows (for long positions) or swing highs (for short positions). Many traders use the height of the CRSI-defined move to set target prices. For example, Larry Connors himself recommended a strategy that involves “buying when the CRSI is below 15 and selling when it is above 85,” based on stock backtests. In a bullish setup, you might take profits once the CRSI returns to neutral or gradually scale out as it approaches the opposite extreme.
Here’s a concise trading checklist:
-
Buy Signal (Long): CRSI dips into oversold (<10) and then turns upwards. Ideally, this aligns with an uptrend.
-
Sell Signal (Short): CRSI rises into the overbought zone (>90) and then begins to fall. Best used when the larger trend is down.
-
Confirmation: Look for confirmation from other indicators (e.g., moving averages, support/resistance, volume) before taking a trade.
-
Stop-Loss: Place stop losses just beyond the recent swing high/low (for long trades, below the “handle” of the cup; for shorts, above the recent peak).
-
Take-Profit: Consider taking partial profits when CRSI returns to neutral or into the opposite extreme band, or use a fixed risk: reward target.
When Not to Use It / Limitations
Despite its advantages, CRSI has its drawbacks. Because it is highly responsive, it can generate many false signals in choppy markets. CRSI tends to produce false signals and should always be used alongside other indicators. In practice, avoid trading solely on CRSI; always combine it with trend filters or volume checks to ensure the signal's validity.
CRSI is also not designed for long timeframes. It works best on 5- or 15-minute charts for cryptocurrency. Using it on daily or 4-hour charts may result in it hovering near its extremes and flipping too frequently. The original developers advise against using CRSI on higher time frames. In summary, use CRSI in the timeframe appropriate for your trading style (intraday or short swing) and refrain from using it for long-term holdings.
Another limitation arises in strong trends. In a robust uptrend, CRSI can remain very high for extended periods. If you sell every time the CRSI crosses 90, you may miss out on significant moves. Similarly, in a market crash, CRSI can stay near 0 while the price keeps falling. It's crucial to consider the broader context - if price action clearly indicates strength or weakness (e.g., breaking major support or resistance), that may take precedence over CRSI signals. A failed CRSI signal can also occur, for instance, when the price breaks above a previous high before the CRSI drops, invalidating the expected reversal.
CRSI Guide (source)
Bonus Tips or Historical Notes
Historical Origin: Connors RSI (CRSI) was popularized by Larry Connors and Cesar Alvarez in their book “Short-Term Trading Strategies That Work.” It is an evolution of Connors’ earlier RSI2 strategy. CRSI can be seen as a combination of RSI(3), streak RSI(2), and a 100-day rate of change (ROC) rank.
Backtest Insight: Historical backtests on stocks have revealed surprisingly high win rates using CRSI. For instance, a strategy such as “buy when CRSI < 15 and sell when CRSI > 85” demonstrated about a 75% win rate and a profit factor of approximately 2 on S&P 500 data. While the cryptocurrency markets have their own dynamics, this suggests that disciplined CRSI entries can be beneficial across different markets.
Indicator Tips: Don't hesitate to adjust the parameters. The standard setting is CRSI(3,2,100), but some traders find that CRSI(2,2,100) or (3,3,100) works better for specific coins or levels of volatility. On Phemex’s platform, you can modify these values. It's advisable to test different settings on historical crypto data (backtesting) to identify what works best for your chosen coin and timeframe.
Volume Confirmation: Although CRSI itself does not incorporate volume, savvy traders often check volume for confirmation. For instance, if CRSI indicates an oversold condition and begins to rise, a spike in trading volume during the reversal can validate the move. Conversely, a CRSI signal appearing on low volume might indicate a weaker signal.
Psychology Reminder: Keep in mind that CRSI is just a numerical representation derived from price data. Consider the reasons behind extreme readings. If current news or fundamentals do not align with the CRSI signal, it’s wise to proceed with caution. CRSI does not take into account on-chain metrics or macroeconomic events, so always conduct your own due diligence.
Conclusion
Connors RSI is a potent short-term oscillator that captures rapid market swings by integrating multiple momentum signals. It is particularly effective at identifying extreme market sentiment—when the cryptocurrency market experiences panic or euphoria—and turning that into actionable trade signals. By incorporating CRSI into your trading strategy, you can time your entries on pullbacks or reversals more accurately. The key is to use CRSI in alignment with the overall market trend, confirm signals with other forms of analysis, and manage risk with stop-loss orders, as with any trading strategy.
For crypto traders who are ready to implement these insights, Phemex’s trading platform simplifies the process. You can easily add the Connors RSI indicator to any chart on Phemex and combine it with Phemex’s analytical tools. Merging CRSI extremes with chart patterns, moving averages, or our Fear & Greed Index can help you enter trades at favorable levels. This way, you can leverage technical insights while maintaining disciplined risk management.
Start using Connors RSI on Phemex today to enhance your trading timing and manage your trades with confidence. Trade responsibly and utilize CRSI to complement your strategy rather than replace it. Good luck, and may you excel in the market with well-timed trades!
Disclaimer
The content of this article is for informational and educational purposes only and should not be construed as financial, investment, or legal advice. Cryptocurrency and tokenized asset investments carry significant risk, and past performance is not indicative of future results. Always conduct your own research or consult a qualified financial advisor before making investment decisions.