Over the past 24 hours, the XRP market ecosystem has recorded notable shifts in on-chain metrics and trading volume that are currently being evaluated by cryptocurrency analysts. While the asset’s spot price continues to trade within a defined, horizontal consolidation range, recent blockchain data and exchange order book dynamics provide a multifaceted perspective on broader market behavior, institutional participants asset management, and potential macroeconomic positioning.
Evaluating the Reported $738 Million Exchange Outflow
Recent on-chain data aggregates indicate that approximately $738 million worth of XRP has been withdrawn from major cryptocurrency trading platforms over the previous 24-hour cycle. To contextualize this metric within the broader first quarter of 2026, it represents one of the most substantial single-day net outflows recorded for the digital asset year-to-date.
In comprehensive cryptocurrency market analysis, significant exchange outflows are continuously monitored as technical metrics that may suggest evolving market sentiment. When substantial volumes of a digital asset are transferred off centralized trading platforms, it typically corresponds to a reduction in immediate, accessible sell-side liquidity. Industry observers frequently interpret this specific behavior as an indication that large-scale holders—often referred to in market terminology as "whales"—or institutional participants are migrating their XRP holdings into cold storage environments or private custodial solutions.
This migration generally implies a longer-term holding strategy rather than an immediate intent to liquidate at current market prices. In economic theory, if the liquid supply on active exchanges decreases while market demand remains consistent or experiences growth, it can introduce supply constraints. However, it is imperative to acknowledge that cryptocurrency markets operate with high unpredictability, and on-chain supply metrics are just one of many variables that influence market valuations. Past behavioral trends do not guarantee future price performance.
Market Participant Dynamics: Institutional vs. Retail Activity
While on-chain data implies that larger entities may be transitioning assets off the active market, broader retail trading sentiment currently reflects a more measured and cautious approach. Observing this divergence is fundamental for objective market analysis. Current data structures suggest that institutional participants might be aligning their portfolios for longer-term macroeconomic horizons, whereas retail market participants are responding to localized, short-term price volatility, particularly in proximity to the established technical analysis support zones.
Technical Evaluation of the $1.35 Support Zone
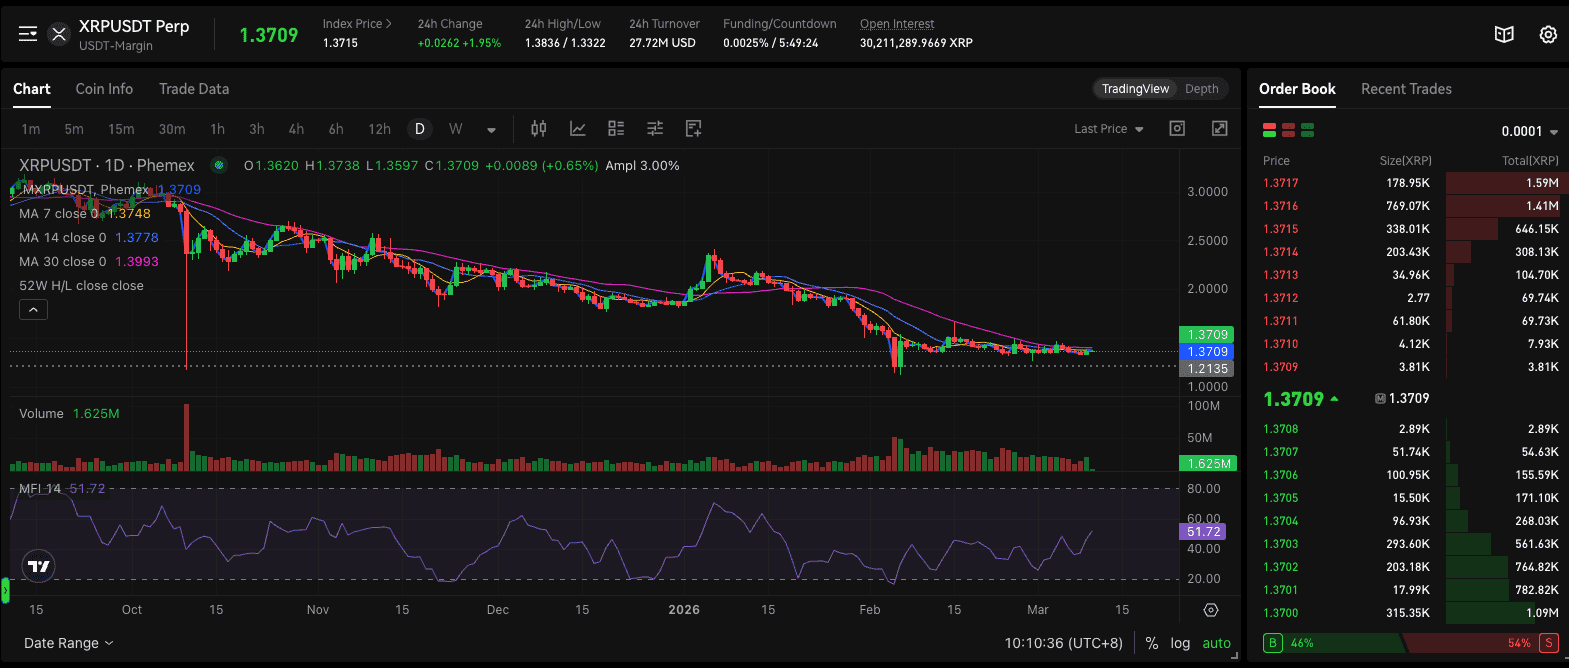
Despite the notable on-chain exchange outflows, XRP’s immediate price action remains highly contested within a narrow trading band. Based on current Phemex trading data as of March 10, 2026, the XRPUSDT Perpetual contract (USDT-Margin) is currently trading at approximately $1.3709.
Fact-Checking the Chart Data and Price Action
A review of the 24-hour trading data reveals a recorded high of 1.3322. This specific price action highlights the ongoing market evaluation of the $1.35 support threshold. During early trading sessions, increased trading volume tested lower price boundaries, pushing the asset to $1.3322 before stabilizing and recovering toward the $1.37 mark. This indicates that sufficient market interest exists to absorb selling pressure at these lower thresholds.
From a technical analysis standpoint, the $1.35 level represents a historical pivot point where previous market resistance transitioned into foundational support zone. Should this support zone be maintained, technical analysts suggest it could preserve the asset's current market structure on the daily and weekly timeframes, providing a basis for potential price consolidation. Conversely, if the price experiences a sustained break below this level, technical indicators suggest a potential market recalibration toward lower support ranges, particularly if automated stop-loss orders are executed across various liquidity pools.
Furthermore, analyzing the daily chart’s momentum indicators provides additional context. The Money Flow Index (MFI 14) is currently resting at a relatively neutral 51.72, suggesting a current state of equilibrium between buying and selling volume, with neither overbought nor oversold conditions dominating the immediate timeframe.
Examining Overhead Resistance: The $1.40 - $1.44 Zone
A common analytical inquiry regarding current on-chain data is: "If substantial liquidity is leaving exchanges, what specific technical factors are constraining XRP's price appreciation?"
A significant contributing factor is the substantial volume of circulating supply currently held by market participants facing unrealized losses. Market intelligence estimates suggest that a large percentage of the circulating XRP supply was acquired at higher valuations during previous market cycles.
The Mechanics of "Break-Even" Selling Pressure
The aggregate cost basis for a notable portion of XRP holders sits near the $1.44 mark. Furthermore, current Phemex chart data illustrates that the 30-day Moving Average (MA30) is positioned at $1.3993, acting as dynamic overhead resistance.
The combination of historical cost bases and technical moving averages creates what analysts refer to as a psychological resistance barrier.
For retail investors who acquired the asset during localized peaks, a return to the $1.40 - $1.44 range may present an opportunity to exit positions without incurring a net financial loss. In trading psychology, this phenomenon leads to "break-even selling." As the price of XRP approaches the $1.40 threshold, the market typically must absorb an influx of limit sell orders. This "overhead supply" acts as a technical ceiling. Surpassing the $1.44 resistance generally necessitates a sustained increase in trading volume capable of fully absorbing this exit pressure.
Market Consolidation and Potential Volatility Scenarios
Currently, XRP is demonstrating a period of consolidation between two distinct market forces:
Support Dynamics: On-chain accumulation patterns and observed buying interest near the 24-hour lows (establishing structural support near $1.33 - $1.35).
Resistance Dynamics: Selling pressure from market participants looking to exit near technical moving averages (creating overhead resistance near $1.40 - $1.44).
When a digital asset experiences tight consolidation between established support and resistance zones, historical data suggests it often precedes a period of heightened market volatility, though the directional outcome of any subsequent price movement remains inherently uncertain.
Objective Methodologies for Analyzing Today's XRP Market Structure
For participants monitoring XRP market trends, navigating the influx of data requires objective evaluation and strict risk management. Because XRP is currently trading within a defined macroeconomic range, precision and methodology are essential.
1. Considerations for Long-Term Market Observers
The reported $738M exchange outflow is a fundamental metric frequently utilized in macro-evaluations. While short-term price fluctuations remain entirely standard for digital assets, on-chain data suggesting a transition to self-custody may indicate sustained interest in the asset's underlying network utility. Observers often monitor how daily candlestick closes react to the $1.35 level to derive insights into the resilience of the current market structure.
2. Approaches for Range-Bound Market Evaluation
The established technical resistance approaching $1.40 makes XRP a potential candidate for range-bound analytical methodologies. Until a definitive market trend is established above $1.45 or below $1.35, the asset may continue to display sideways price action. Professional market participants typically evaluate potential entries near established support zones and plan strategic exits near known resistance parameters, focusing strictly on incremental risk management.
3. Monitoring Volume and Trend Confirmation
Trading volume remains a critical indicator for validating significant price movements. The current 24-hour volume on the Phemex XRPUSDT Perp chart sits at approximately 1.625M. A sustained price movement above $1.45, accompanied by a substantial spike in trading volume, might indicate that overhead selling pressure has been absorbed. Conversely, trend confirmation methodologies prioritize waiting for daily closes above moving averages before assuming a directional bias.
Exploring Phemex Infrastructure for XRP Market Analysis
The trading conditions observed on March 10, 2026, underscore the importance of utilizing professional-grade trading infrastructure. Whether your objective is to facilitate long-term asset management or to actively monitor the $1.35 to $1.44 trading range, Phemex offers a comprehensive suite of tools designed to execute market strategies with robust risk management protocols.
1. Navigating Spot Markets (Phemex XRP Spot Trading)
For users whose analysis aligns with long-term asset holding, the spot market allows for direct, unleveraged acquisition of the digital asset. Phemex provides deep order book liquidity, aiming to offer optimal execution prices with minimized slippage for participants intending to transfer assets to private custodial solutions.
Educational Resource: Explore the mechanics of Spot Trading on Phemex.
2. Utilizing Margin Capabilities (Phemex Margin Trading)
For experienced participants, Phemex Margin allows eligible users to borrow funds against their existing collateral. This feature can increase exposure to potential price movements within the established trading ranges. However, it is absolutely critical to understand that margin trading carries a high degree of risk, as it mathematically multiplies both potential profits and potential losses equally.
Educational Resource: Review the risk parameters of Margin Trading on Phemex.
3. Exploring Derivatives and Hedging (XRPUSDT Perpetual Futures)
The Phemex XRPUSDT Perpetual contract currently shows an Open Interest of 30,211,289.9669 XRP, indicating robust participation in the derivatives market. The current funding rate sits at a nominal 0.0025%. Perpetual futures allow advanced traders to take both Long and Short positions, providing the flexibility to navigate market movements in either direction or to execute hedging strategies against existing spot portfolios to mitigate downside risk.
Educational Resource: Understand Contract Specifications for XRPUSDT Futures.
The Broader Context: XRP Market Positioning in 2026
To fully comprehend the current technical standoff, it is helpful to contextualize XRP's broader utility landscape in 2026. Over the past year, the XRP Ledger (XRPL) ecosystem has continued to evolve, expanding its infrastructure beyond traditional cross-border payment use cases. With the continued advancement of smart contract functionalities and the integration of the Ripple-backed stablecoin (RLUSD) within institutional frameworks, XRP is increasingly analyzed by macroeconomic observers for its role as a fundamental liquidity mechanism.
The notable outflows observed today may correlate with institutional liquidity providers adjusting their operational portfolios as the financial year transitions toward the second quarter. In the current landscape, XRP's market valuation is evaluated not only through the lens of retail participation but also through its ongoing integration into broader, regulated financial infrastructures.
Concluding Market Observations for March 10, 2026
The current technical landscape for XRP presents a classic market consolidation phase. On-chain metrics display large-scale entities transferring supply off centralized platforms, while technical charts highlight a considerable volume of overhead resistance driven by historical cost bases and key moving averages like the MA 30 at $1.3993.
The $1.35 support threshold remains a focal point for evaluating short-term market trajectory. While current technical structures lean toward stability as long as this zone is maintained, market volatility remains a constant factor. In a highly active market environment, utilizing a platform with advanced security, transparent data feeds, and comprehensive order types like Phemex is a valuable component of an institutional-grade approach to digital assets. Regardless of your analytical stance, maintaining disciplined risk management, utilizing appropriate stop-loss limits, and closely monitoring volume and open interest metrics are mandatory practices for navigating the digital asset space.