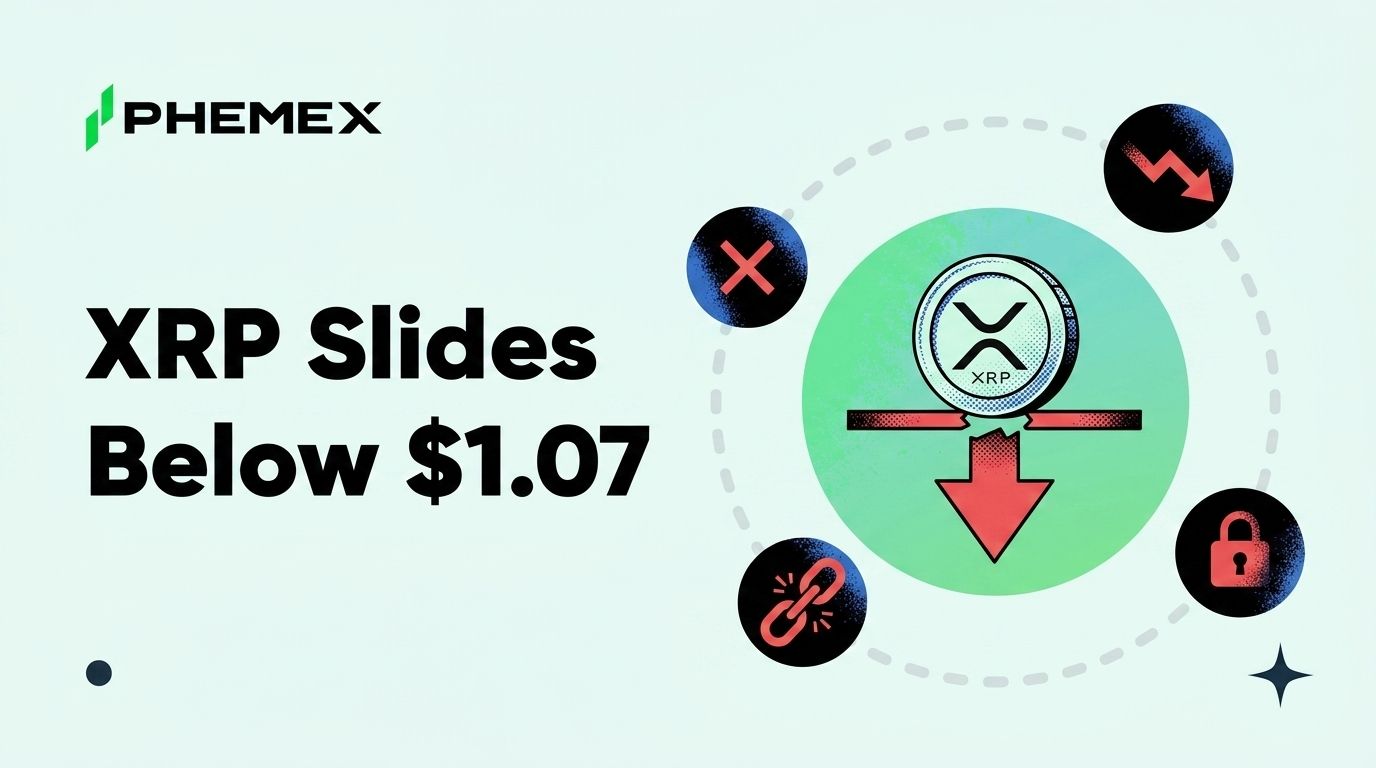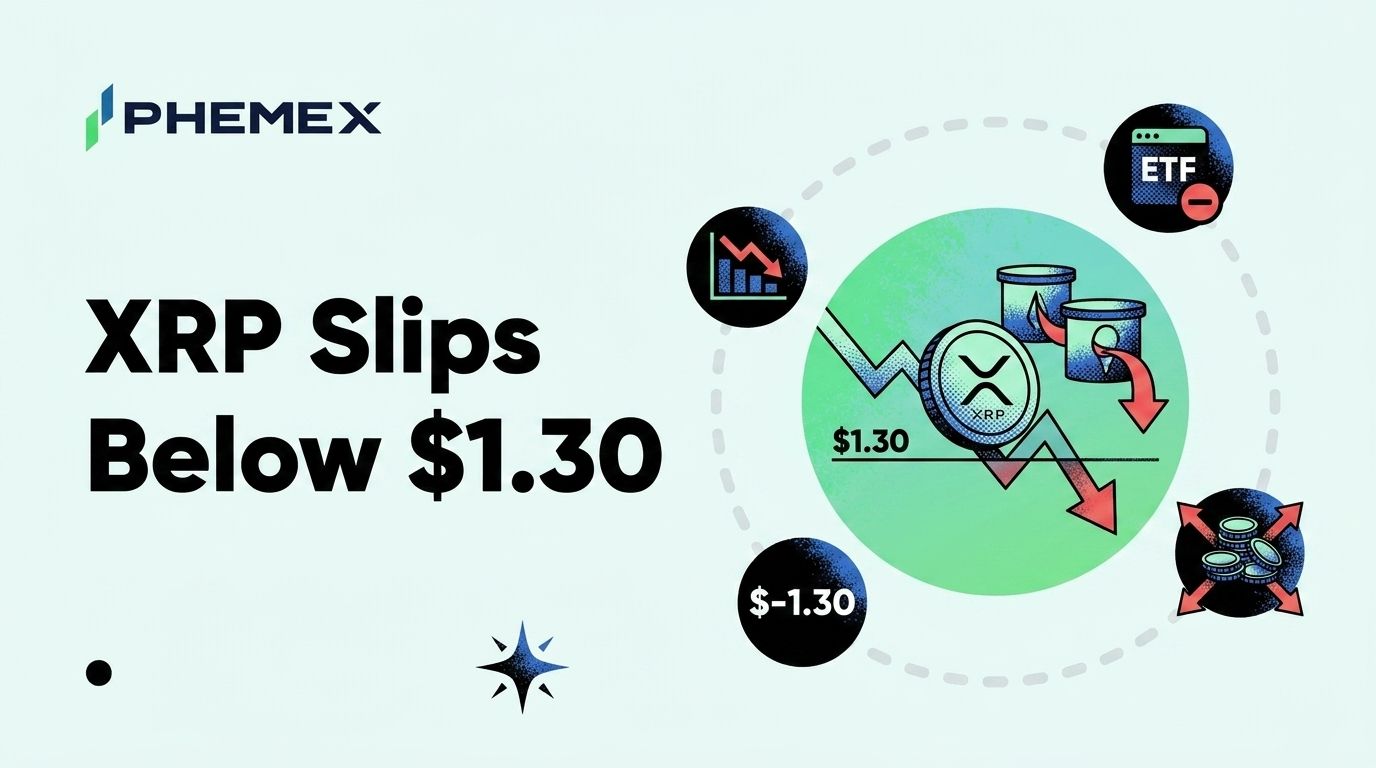
XRP broke below $1.30 on June 2 for the first time since April, closing the session at $1.281 and trading another half percent lower in the overnight tape. The market cap dropped from $78.4 billion to $77.1 billion and the ranking slipped one place from #5 back to #6 behind BNB. The break is the cleanest signal yet that the Bitcoin ETF outflow wave is no longer contained to BTC and is now spreading into altcoin fund flows. XRP spot ETF products took $35 million in net inflows in the third week of May, which was a rare bright spot during the BTC and ETH bleeds, but turned net negative in the final week as the broader altcoin-fund outflow wave caught up.
Here is what the flow pattern actually shows, where XRP has to hold to keep the structural recovery thesis intact, and what catalysts are sitting in the queue that could flip the tape.
How the Altcoin ETF Outflow Wave Started
The altcoin ETF complex was the last segment of the spot crypto fund universe to absorb the May outflow wave that started in BTC and ETH. The reason is structural. Altcoin spot ETFs launched in stages through late 2025 and early 2026, which means most of the institutional allocators in those funds entered on the basis of a longer-dated rerating thesis rather than as part of an active rebalancing book. Active rebalancing flows show up first in the largest and most liquid products, which is BTC, then in the second-tier, which is ETH, then in the rest.
The mechanical sequence has now landed. XRP, SOL, and DOGE spot ETFs all printed net outflows in the final week of May after holding inflows through the first three weeks. The cumulative altcoin ETF outflow across the four trackable products through the last seven sessions is approximately $215 million, which is small in absolute terms but structurally significant because it confirms the broader passive allocator rebalancing is now affecting every spot crypto product, no longer only BTC.
The XRP spot ETF complex specifically has aggregate assets of roughly $4.2 billion across the trackable issuers. A $40 million weekly outflow is roughly 1% of AUM, which is consistent with the magnitude of the BTC outflow pace and suggests the bleed could extend for another two to three weeks before exhausting.
The Levels That Define the Next Move
XRP technical structure has been defined by the $1.25 to $1.30 range as the lower support band and the $1.45 to $1.50 zone as the upper resistance band. The break of $1.30 on June 2 opens the test of $1.25, which is the level that has held every prior pullback since the late-April rally. A clean daily close below $1.25 would invalidate the recovery structure and open a measured move to $1.10, which was the March 2026 low.
The volume profile on the past 30 sessions shows the heaviest spot accumulation in the $1.28 to $1.34 zone, which means current price action is sitting inside the largest spot bid cluster on the chart. That structure favors a defense of $1.25 in the near term, but the structure breaks if the ETF outflow pace accelerates rather than stabilizes.
On the upside, the first resistance is the $1.32 to $1.34 zone, which was the support shelf before the break and now flips to resistance per the standard structure read. A reclaim of $1.34 with rising volume would be the first confirmation that the break of $1.30 was a false break. A break of $1.45 would be the confirmation that the broader recovery structure is intact and the next leg can develop.
The Catalysts Sitting in the Queue
The most immediate catalyst is the CLARITY Act full Senate vote. The Senate markup has been completed and the bill is in the floor queue for a vote between mid-June and early July. The CLARITY framework explicitly assigns spot market authority over digital commodities to the CFTC, which would functionally end the legal uncertainty around XRP that has gated institutional adoption since the SEC v Ripple ruling. A clean Senate passage with the current language would be the largest single catalyst for XRP in 2026.
The second catalyst is additional ETF issuer activity. Multiple smaller issuers have S-1 filings pending for second-generation XRP spot products with different fee structures than the initial cohort. SEC approval of any of those filings would expand the addressable institutional market and could meaningfully shift flow dynamics. The historical analog from BTC and ETH suggests the second-generation ETF launches typically expand AUM by 20% to 40% over the following 12 weeks.
The third catalyst is Ripple's institutional payment deal pipeline. The company has signaled multiple deal closures in the Q3 window, including extensions of the existing Asian banking partnerships and the first material deal in the Latin American corridor. Each deal closure historically adds 4% to 8% to the XRP price over the following week as institutional allocators front-run the utility narrative. The aggregate deal pipeline through Q3 could meaningfully offset the ETF outflow drag.
How XRP Compares to the Other Altcoin ETF Components
The XRP spot ETF complex has performed better than the SOL spot ETF complex through the May outflow wave on a relative basis. SOL ETF AUM is materially smaller and the outflow pace has been more pronounced. DOGE ETF AUM is even smaller and the flows have been the most volatile of the altcoin set. XRP sits in the middle of the altcoin ETF complex in both AUM and flow stability, which positions it as the most institutional-grade non-BTC, non-ETH crypto product in the US market.
That positioning is the structural argument that the Ripple XRP thesis has improved through the past 12 months even as the spot price has compressed. The legal clarity, the ETF complex, and the institutional payment pipeline together support a multi-year rerating that does not depend on near-term flow direction. The flow direction matters for tactical positioning but not for the structural call.
The relative performance argument also matters for the ratio trades. XRP/BTC has held a tight range through the May bleed even as XRP has dropped in dollar terms, which means XRP is holding its own against BTC even with the ETF outflow drag. That structural strength is the positioning desk view that supports a tactical reload at the $1.25 level if it holds.
The Macro Overlay
The macro setup for XRP is the same as for BTC and ETH. Soft CPI in mid-June or any concrete catalyst from the Trump White House BTC reserve architecture deadline would be the cleanest upside trigger. A hot CPI print or a fresh geopolitical risk-off shock would be the cleanest downside trigger. XRP-specific positive catalysts (CLARITY Act passage, additional ETF issuer approvals, Ripple deal closures) compound the macro tailwind when they arrive but cannot fully override macro headwinds when they do not.
The XRP options market on the regulated US complex has built up open interest at the $1.50 strike, which is the largest single concentration. That positioning suggests institutional traders are still pricing a recovery scenario into the late June expiry rather than a continuation lower. Put-call ratio sits at 0.62, which is the bullish side of neutral.
Frequently Asked Questions
Why did XRP just slip below $1.30 in June 2026?
The break is the lagged spread of the Bitcoin ETF outflow wave into altcoin spot ETF products. XRP spot ETFs held net inflows through the first three weeks of May but turned net negative in the final week as passive allocators rebalanced across every spot crypto product. The cumulative altcoin ETF outflow over the past seven sessions is approximately $215 million.
Where is the next major XRP support level?
The $1.25 zone is the next major support and is the level that has held every prior pullback since the late-April rally. A clean daily close below $1.25 would invalidate the recovery structure and open a measured move to $1.10, which was the March 2026 low. The volume profile on the past 30 sessions shows heaviest spot accumulation in the $1.28 to $1.34 zone.
What is the next major XRP catalyst?
The full Senate vote on the CLARITY Act, expected between mid-June and early July. The framework explicitly assigns spot market authority over digital commodities to the CFTC and would functionally end the legal uncertainty around XRP. A clean Senate passage with the current language would be the largest single catalyst for XRP in 2026. Additional ETF issuer S-1 approvals and Ripple's Q3 institutional deal pipeline are secondary catalysts.
How does XRP compare to the other altcoin spot ETFs?
XRP sits in the middle of the altcoin ETF complex in both AUM and flow stability. The XRP ETF complex has held up better through the May outflow wave than SOL and DOGE on a relative basis. That positioning makes XRP the most institutional-grade non-BTC, non-ETH crypto product in the US market and supports the multi-year rerating thesis independent of near-term flow direction.
Bottom Line
XRP broke below $1.30 on June 2 because the Bitcoin ETF outflow wave finally reached the altcoin fund complex. The break is a tactical signal rather than a structural one. The $1.25 level defines the next test, and the volume profile favors a defense of that zone. The structural recovery thesis breaks only on a clean daily close below $1.25 with the ETF outflow pace still accelerating.
The catalyst queue is unusually full. The CLARITY Act Senate vote in mid-June or early July, additional ETF issuer S-1 approvals, and the Ripple institutional deal pipeline in Q3 are all sitting as positive triggers that could individually reverse the flow direction. Watch the daily altcoin ETF print for the first green session that breaks the outflow streak, and watch for any signal that the Senate vote is moving forward. XRP holders are positioned for the structural call. The June flow tape is the tactical noise around it.
This article is for informational purposes only and does not constitute financial or investment advice. Cryptocurrency trading involves substantial risk. Always conduct your own research before making trading decisions.