

There are a wide variety of trading channels used to denote different price trends and movements in the financial industry. By providing one of the most important overlays that an analyst can apply to a price’s technical chart, trading channels allow investors to buy/sell with increased security. This helps add weight to financial decision making and strategy formulation, which in turn gives a trader the best chance of profiting from the movement of an asset or security. By using trading tools like channels, investors put themselves in the best possible position to profit from price movement, allowing them to identify patterns ahead of time based on historical market fluctuation. But what exactly are trading channels?

What Is a Trading Channel?
Created by charting asset/security prices over select periods of time, trading channels are usually made by drawing two parallel lines, called trend lines, across a price analysis chart. These lines denote high and low closing prices, meaning the recording of the asset’s high and low prices at the end of a trading day — with the upper trend line representing the price’s highest high recorded that day and the bottom line corresponding to the lowest low. Generally, traders look to trade within these lines; looking to buy when in the upper trend section and sell during a downshift. However, the real money is made when there is what is known as a “channel breakout,” meaning a price dramatically falls outside of what a trading channel indicator predicts (in either direction). These are seen as golden opportunities and swift action must be taken in order to maximize profitability during these occasions.

Trading channels are also used to identify what are known as support and resistance levels, again denoted by trend lines. However, these trend lines occur in slightly different areas: “support” shows the level where a trend is expected to pause its downward trajectory and “resistance” is defined as the exact opposite (i.e., a pause point in an uptrend). Support and resistance levels are bars that act as price watermarks, with the names being derived from the fact that these bars are seen as difficult to shift. They effectively create barriers that, when broken, often produce much interest in the breakout asset or security being traded. Whether that interest is bullish or bearish, however, depends on the direction of that asset/security’s trend, and whether that trend is seen as likely to continue.

Support and resistance lines (source: dailyfx)
Channel patterns are normally used in technical analysis to identify uptrends and downtrends in asset/security price, giving rise to ascending channel trading and descending channel trading, respectively. These simplistic channel patterns are seen as some of the most recognizable, and perhaps even best, channels available for use in formulating trading strategies; thus, this seems a good place to start this explanation.

Which Channels Are Best for Trading?
Ascending and Descending Channels
The trading channels of choice for the majority of traders are the descending and ascending (sometimes called rising) channels. Whether or not they are the “best” is of course subjective, but these patterns are nevertheless the standard when it comes to channel trading and trading channel indicator analysis. The following section will explore some of these trading channels:
- Ascending channels: Sometimes referred to as rising or bullish channels, ascending channels are created by drawing a conventional trend line along a price’s lowest high point (or bottom of support). A second, parallel line is then drawn that runs along the highest point of the price being analyzed, creating a space in between called an ascending channel. These are a good indicator of an upwards trend.
- Descending channels: Sometimes referred to as bearish channels, descending channels are formed instead by drawing a trend line that travels along a price’s highest low point (called the top of resistance). A second, parallel line is then drawn that runs along the lowest point of the price being analyzed, creating a space in between called a descending channel. These are a good indicator of a downwards trend.
- Flat channels: These occur when trend lines do not slope in either direction, showing sideways (or circular) movements within a market, with no particular advantage given to buyers or sellers.
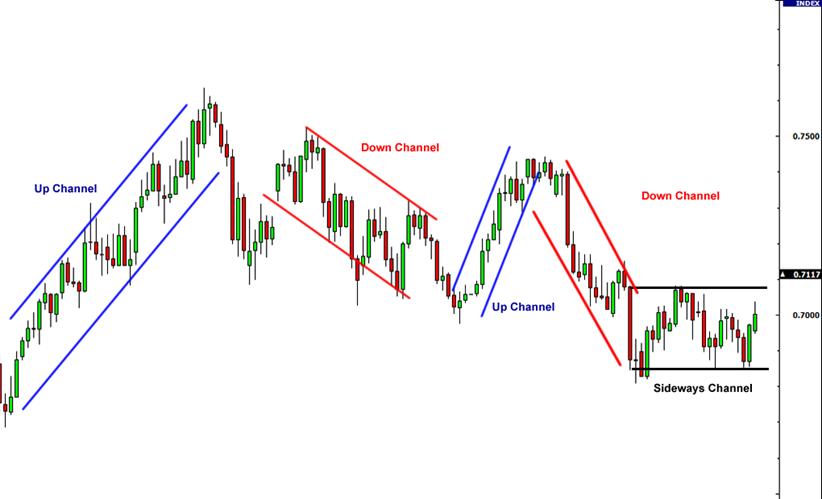
Trading channels, showing rising channel patterns and descending channel patterns (source: babypips)
Ultimately, whether an investor trades in a bullish or bearish manner on a descending/ascending channel is entirely up to them and the strategy they feel best suits their needs at that time. Technical analysis on both descending and rising channels would generally advise that investors/traders should buy into (or go long on) an uptrending asset, and sell off (or go short on) a downtrend. However, how much they should subscribe to this idea, and for how long they should follow a trend is entirely up to them. This, in a nutshell, is why analyzing and accurately calculating trading channels and trend lines is vitally important — as it gives traders a basis by which to formulate and facilitate financial decision making.

Example of channel trading strategy (source: tradingsetupsreview)
What Other Types of Trading Channels and Strategies Are There?
While it is important to understand the most basic and popular uses for channel trading indicators and their associated patterns, it is also vital to realize that there are many more uses to be had from such concepts. There are many terms, patterns, and strategies that are used in channel trading and channel trading analysis.
- Channel surfing trading: Channel surfing, despite the name, is actually a fairly complex concept that involves charting the market using geometry; providing a dynamic method of risk control, stop placement, and quick, in depth market analysis. Put simply, it involves getting in on trends early, making a quick (if not maximized profit), and exiting early, thereby minimizing the likelihood of loss. The famous book by Michael Parsons, “Channel Surfing: Riding the Waves of Channels to Profitable Trading,” was written on the subject and goes into great depth in its analysis of such strategies.
- Donchian channel turtle trading: While possibly not the best-known form of technical analysis, Donchian channels help investors, analysts, and brokers alike visualize price trends simply and effectively. Used in conjunction with turtle trading (an incredibly successful strategy developed by Richard Dennis, once under strict copyright, but now mostly in the public domain), this strategy allows traders to recognize and utilize price trends more effectively. This works across all timescales and includes a lot of metrics that apply critical and intuitive thinking, such as investing more money when the market is predicted to be (and remain) less volatile than usual, and vice versa. Michael Covel wrote a book on this subject, entitled “The Complete TurtleTrader: The Legend, The Lessons, The Results.”
- CAP channel trading strategy: CAP channel trading involves identifying and profiting from overbought/oversold conditions, based on volatility backed data. This generally involves using a technical price analysis chart of some kind (a TRIX or MACD indicator, for example) in order to better assess the supply and demand levels for a particular asset/security. CAP channel trading is seen as a measure of price instability, allowing investors the opportunity to effectively risk-manage their investments using data-driven decisions. This concept is fully explored in the book by Perry J. Kaufman, “Trading Systems and Methods.”
- Linear regression channel trading strategy: Linear regression is defined as the analysis of two separate variables (generally prices, in finance) to define the relationship between them, which is understood as a useful measure in technical analysis. It will generally do this by adding a third line which acts as a middle (or median point) to try and ascertain how fluctuations in supply, demand, and price affect the two other price points simultaneously. The indicator was developed by Gilbert Raff, and is often referred to as the Raff Regression Channel. In fact, Mr. Raff wrote a book on the subject, titled “Trading the Regression Channel: Defining and Predicting Stock Price Trends.”

Does Channel Trading work?
Yes, channel trading is used in virtually every form of technical financial analysis for a reason, as it allows investors the simplest and easiest path to using data in their trade strategies. Additionally, at least on the surface, they do not require a huge amount of study, a background in mathematics, or any other forms of analysis to be understood. However, as one might expect, there are still nuances to channel trading.
Pros and Cons of Channel Trading
Here are some of the basic advantages associated with stock- and commodity-based channel trading:
- High returns: Investing in stocks by applying channel trading techniques has given reasonably high returns among various asset classes, using long-term investment strategies.
- Minimized risk: Investing using channel trading strategies allows investors to minimize their risk simply and effectively by providing data that gives weight to their decision-making process.
- Highly diversifiable: Channel trading is highly variable and can be applied to virtually any form of investment that can be charted (which is essentially every form of investment). This gives traders a multitude of opportunities for growth across various countries, asset classes, and markets.
As would generally follow, there are also a number of disadvantages associated with channel trading assets/securities:
- Volatility: Channel trading can be highly subject to volatility and unpredictable price fluctuations, especially when used over shorter time periods.
- Human error: Despite everything, human error can still affect the data given by channel trade indicators — though obviously this is somewhat mitigated by the applied parameters of the indicator in question. However, to discount the possibility of human error would be foolish, which is why accurate technical analysis often takes years of study to develop an intrinsic knowledge of how to spot such errors.
- False signals: Channel trading indicators, just like any form of technical analysis indicator, can be subject to error, which can give false positive/negative signals that can mislead an investor. This is why all indicators should be used in conjunction with others, providing the most accurate and in-depth analysis possible.

Trading channel patterns (source: pinterest)
Conclusion
Trading channels are an essential part of price analysis. Without concepts such as these, investors would make important financial decisions blindly, being subject to the whimsical movements of an uncaring market. It is only through the diligent study of past price fluctuations and the identification of the root economic causes of these shifts in the supply/demand chain that traders can successfully formulate and implement winning strategies. Trading channel indicators (and tools like them) assist this kind of study immensely. Trading channel analysis gives brokers knowledge on how the market is likely to behave ahead of time, allowing them a competitive advantage over their colleagues, and provides for themselves (and/or their clients) the highest likelihood of profitability. If all it takes is channeling one’s inner reserves, or willpower, to channel one’s outer reserves, or capital, then it seems a small price to pay to reap the potential rewards and benefits.
Read More
- What is Donchian Channel: The Secrets of Intraday Trading and How to Use Them
- What Is Price Channel Indicator: Trade the Highest Highs & Lowest Lows
- What Is Trend Trading: Following the Market When It Pays
- How to Read Crypto Charts: Learn Trading Chart Patterns
- Uptrends and Downtrends: How to Spot and Trade Them?
- What is Keltner Channel: Best Alternative to Bollinger Bands for Bitcoin (BTC)
- What are Highs and Lows in Trading: The World of Financial Highs and Lows
- TradingView: What Is It and How to Use It to Trade with Phemex