


Key Takeaways
Crypto swing trading focuses on capturing short- to medium-term price moves that can last from several days to several weeks.
The best technical indicators for crypto swing trading are usually the ones that help traders read trend, momentum, volume, and volatility clearly.
Moving Averages, RSI, MACD, Volume, and Bollinger Bands are among the most practical and widely used tools for swing traders.
No single indicator is enough on its own. The strongest setups usually come from confluence between multiple signals and price action.
Good swing trading is not just about finding entries. Risk management, position sizing, and patience matter just as much as the indicator itself.
Swing trading occupies a middle ground between day trading and long-term investing. Instead of entering and exiting positions within minutes or hours, swing traders aim to capture larger price moves that develop over several days, and sometimes even several weeks. In crypto, where volatility is high and market sentiment can shift quickly, this style of trading can be especially attractive.
But volatility is a double-edged sword. The same market that offers sharp upside can also reverse violently, fake out breakouts, and punish traders who rely on emotion instead of structure. That is where technical indicators come in.
Indicators do not predict the future with certainty. What they do is help traders organize market information. They can highlight whether the market is trending or ranging, whether momentum is strengthening or fading, whether a breakout has conviction, and whether volatility is expanding or compressing. In other words, indicators help swing traders make better decisions under uncertainty.
The problem is that many traders use too many of them. They crowd their chart with overlapping signals, wait for perfect alignment that never comes, or treat every crossover and oscillator reading like a guaranteed trade. In practice, the best swing traders tend to rely on a small, focused toolkit.
What Makes an Indicator Useful for Swing Trading?
Not every indicator is equally helpful for swing trading. Some are too noisy for volatile crypto markets. Others are better suited to scalping, extremely short-term execution, or niche market conditions. A good swing-trading indicator should do at least one of a few important jobs well.
First, it should help define trend direction. Swing traders usually do better when they trade in the direction of the broader move rather than constantly trying to catch every top and bottom. An indicator that tells you whether the market is generally bullish, bearish, or neutral already provides major value.
Second, it should help assess momentum. A trend can exist, but momentum tells you whether that trend is strengthening or weakening. For swing traders, that matters because timing is everything. A good trend entered too late can still become a bad trade.
Third, it should offer insight into market participation or conviction. Not every breakout is real. Not every bounce has strength behind it. Indicators tied to volume or volatility can help separate stronger moves from weaker ones.
Finally, a useful indicator should be easy to combine with price action. The goal is not to replace the chart. The goal is to read the chart better.
That is why the best swing-trading systems are usually built around confluence. A trader might use one indicator for trend, another for momentum, and another for confirmation. When several pieces of evidence point in the same direction, the trade idea becomes more robust.
Indicator #1: Moving Averages
What They Are
Moving averages are among the most basic and most effective tools in technical analysis. They smooth out price action by calculating the average price over a set period, which helps traders identify trend direction more clearly.
The two most common types are:
Simple Moving Average (SMA): gives equal weight to all data points in the selected period
Exponential Moving Average (EMA): gives more weight to recent prices, making it more responsive
For swing trading, common settings include the 20 EMA, 50 EMA or SMA, 100 SMA, and 200 SMA. Shorter moving averages react faster, while longer ones provide a broader view of the market trend.

Why Swing Traders Use Them
Moving averages are powerful because they simplify the market. Instead of reacting to every candle, traders can focus on whether price is generally above or below a key average.
They are useful for:
identifying the dominant trend
spotting dynamic support and resistance
filtering out low-quality countertrend trades
reading overall market structure
For example, if Bitcoin is trading above its 20 EMA and 50 EMA, and both averages are sloping upward, that often supports a bullish swing-trading bias. If the price is below them and they are sloping downward, that suggests weakness.
How to Use Them in Crypto Swing Trading
Swing traders often use moving averages as a trend filter first and an entry aid second.
A simple approach could look like this:
use the 50 EMA to define the medium-term trend
use the 20 EMA to track shorter-term momentum
look for pullbacks into these averages during established trends
In an uptrend, price often pulls back toward the 20 EMA or 50 EMA before resuming higher. That pullback can offer a more attractive entry than chasing a strong green candle. In a downtrend, rejected rallies into these averages can serve as warning signs or potential short entries, depending on the trader’s strategy and market access.
Some traders also watch for moving average crossovers, such as a shorter average crossing above a longer one. These can be helpful, but they should not be used blindly, especially in sideways markets.
Limitations
Moving averages are lagging indicators. They react to price rather than anticipate it. That means they work best in trending environments and can produce false signals when the market is choppy.
They are most useful when paired with another tool that helps measure momentum or confirmation.
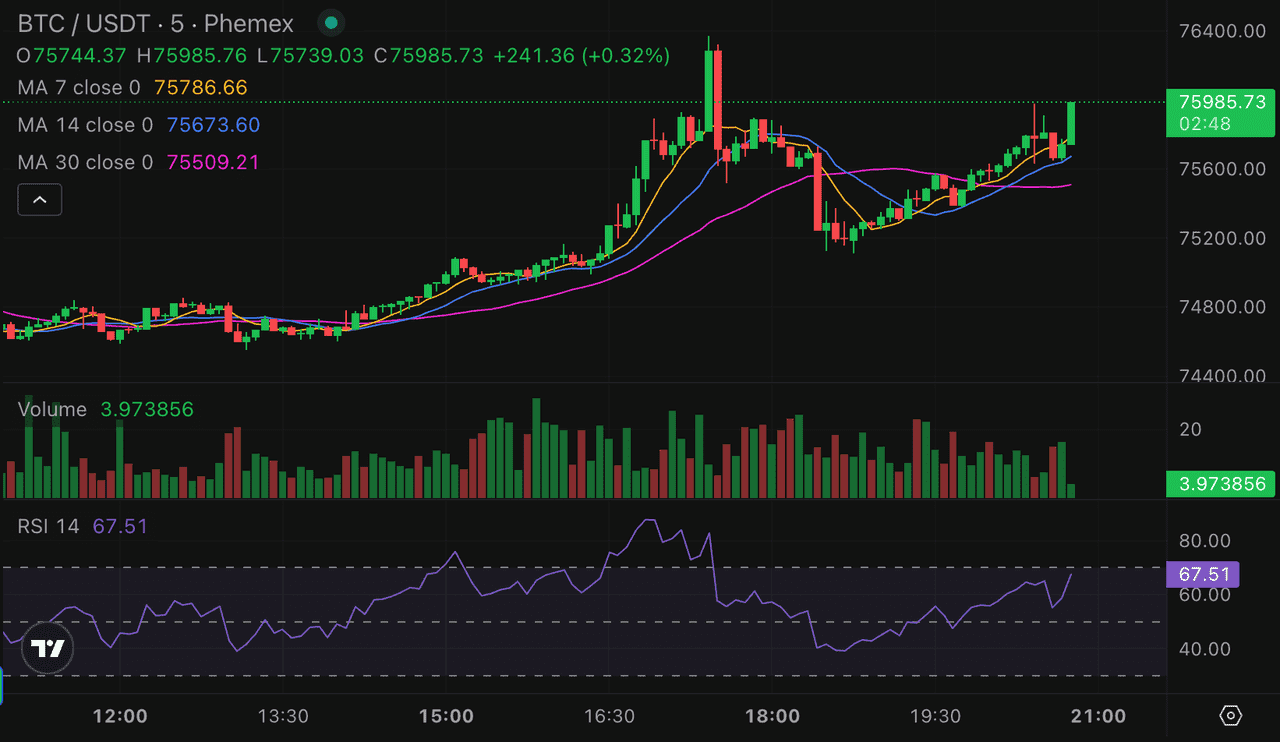
Indicator #2: Relative Strength Index (RSI)
What It Is
The Relative Strength Index, or RSI, is a momentum oscillator that measures the speed and magnitude of recent price changes. It moves on a scale from 0 to 100.
Traditionally:
above 70 is considered overbought
below 30 is considered oversold
But swing traders should be careful with those labels. Overbought does not automatically mean price must fall, and oversold does not automatically mean price must rise.
Why Swing Traders Use It
RSI is useful because it helps traders understand whether momentum is supportive of the current move or starting to weaken.
It can help:
assess bullish vs. bearish momentum
identify possible exhaustion points
spot bullish or bearish divergence
improve entry timing during pullbacks or reversals
One of the most practical ways to use RSI in swing trading is not just through 70 and 30, but through the 50 level. Generally speaking, RSI above 50 suggests stronger bullish momentum, while RSI below 50 suggests stronger bearish momentum.
How to Use It in Crypto Swing Trading
For swing traders, RSI works well as a context tool rather than a mechanical signal generator.
Examples:
In an uptrend, a pullback that brings RSI down near 40 to 50 and then turns back up can support a continuation setup.
In a downtrend, RSI failing to reclaim 50 may support bearish continuation.
A bullish divergence, where price makes a lower low but RSI makes a higher low, may hint that downside momentum is weakening.
A bearish divergence, where price makes a higher high but RSI makes a lower high, may signal fading strength.
This makes RSI especially useful when price is approaching key support or resistance. The indicator can help answer whether momentum supports the breakout or suggests exhaustion instead.
Limitations
RSI can stay overbought or oversold for long periods during strong trends. That is why traders often lose money by trying to fade every overextended market too early.
RSI should be used with structure and trend context, not in isolation.
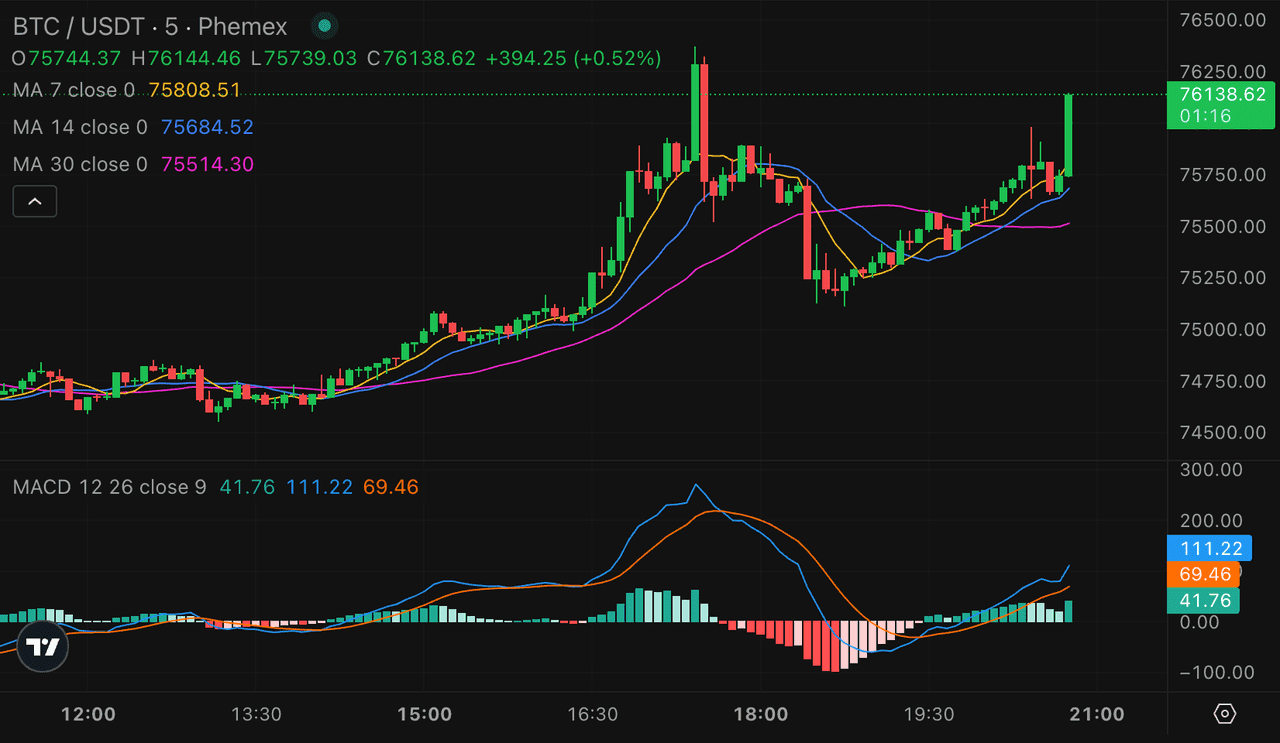
Indicator #3: MACD
What It Is
MACD stands for Moving Average Convergence Divergence. It is a trend-following momentum indicator built from moving averages.
It usually includes:
the MACD line
the signal line
the histogram
The relationship between these components helps traders assess whether momentum is accelerating or weakening.
Why Swing Traders Use It
MACD is popular because it combines two important things: trend direction and momentum shifts. It is especially useful for traders who want to confirm whether a move has real follow-through.
It can help with:
spotting bullish and bearish momentum shifts
confirming trend continuation
identifying early signs that momentum is changing
filtering out weak breakouts
How to Use It in Crypto Swing Trading
A common bullish signal occurs when the MACD line crosses above the signal line, especially if this happens below the zero line and begins rising. A bearish signal occurs when the MACD line crosses below the signal line.
The histogram is also useful. If it is expanding upward, bullish momentum may be strengthening. If it is contracting after a strong move, momentum may be fading.
For swing traders, MACD works best when used as a confirmation tool:
if price breaks resistance and MACD confirms with bullish expansion, that breakout may have better odds
if price is rising but MACD weakens or diverges, that may signal caution
if price reclaims a key level and MACD turns positive, that can strengthen the setup
Limitations
Like moving averages, MACD is still a lagging indicator. It often confirms a move after it has already started. In sideways conditions, it can generate whipsaws that are not very useful.
That is why MACD is best combined with trend analysis, support/resistance, or volume.
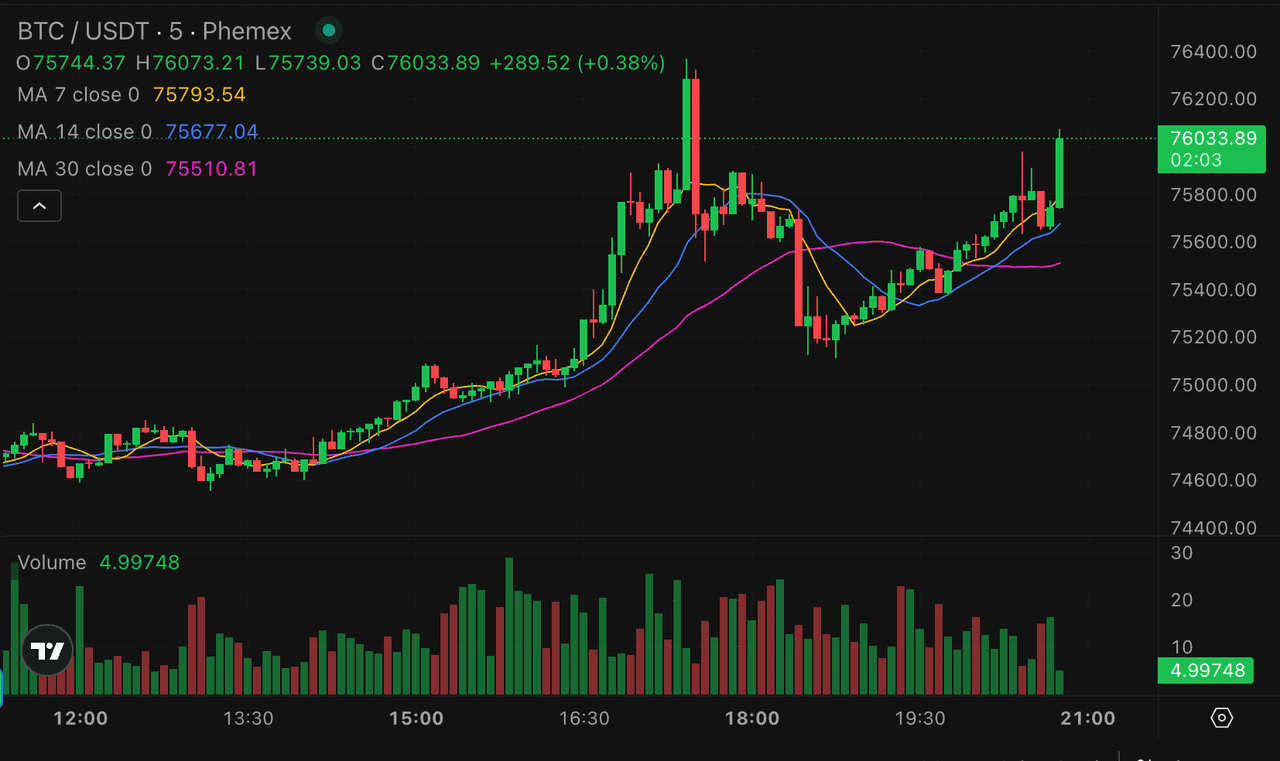
Indicator #4: Volume
What It Is
Volume measures how much of an asset is being traded during a certain period. Unlike many other indicators, it is not derived only from price. It reflects participation.
That matters because price alone does not always tell the full story. A breakout on weak volume may be fragile. A move supported by rising volume often carries more conviction.
Why Swing Traders Use It
Swing traders use volume to judge whether a move has real interest behind it.
It can help:
validate breakouts and breakdowns
confirm trend continuation
spot weakening moves
identify possible capitulation or climax points
In crypto, where fakeouts are common, volume is especially valuable because it helps distinguish stronger moves from those driven by thin participation.
How to Use It in Crypto Swing Trading
One of the clearest applications is in breakout trading.
If price breaks above resistance with a meaningful pickup in volume, the move is often more credible than a breakout that occurs on thin activity. Likewise, if price breaks support on strong volume, bearish follow-through becomes more plausible.
Volume can also help interpret pullbacks:
rising price on falling volume may suggest the move lacks conviction
falling price on shrinking volume may imply selling pressure is not especially strong
a large volume spike near a major level may signal a turning point, either through capitulation or aggressive buying/selling
Swing traders often combine volume with chart structure. For example, if a coin breaks out of a consolidation pattern and volume expands sharply, that adds confidence to the setup.
Limitations
Volume is important, but not always easy to interpret perfectly in crypto. Different exchanges can show slightly different profiles, and raw volume alone does not tell you whether buyers or sellers are in control.
It works best as a confirmation layer rather than a standalone entry signal.
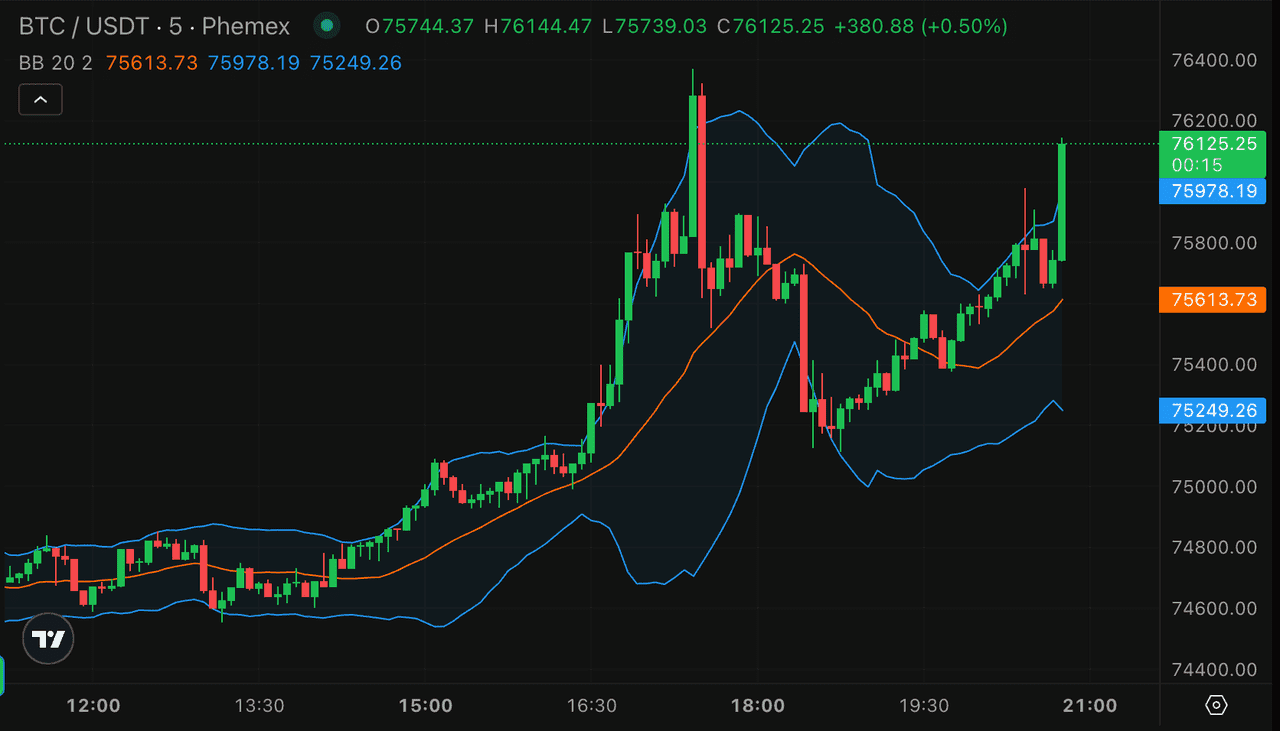
Indicator #5: Bollinger Bands
What They Are
Bollinger Bands are volatility-based bands plotted around price, usually built from a moving average and standard deviations above and below it.
They consist of:
a middle band, usually a moving average
an upper band
a lower band
When volatility increases, the bands widen. When volatility contracts, the bands narrow.
Why Swing Traders Use Them
Bollinger Bands help traders understand volatility conditions, which is very useful for swing trading. Strong swing setups often begin when volatility has compressed and is preparing to expand.
They can help:
identify periods of tightening price action
spot possible breakout setups
highlight stretched price conditions
provide context for mean reversion vs. trend continuation
How to Use Them in Crypto Swing Trading
A classic Bollinger Band concept is the squeeze. When the bands narrow significantly, volatility has compressed. This often precedes a larger move, though it does not tell you the direction by itself.
Traders may also use the bands to assess whether price is extended:
repeated closes along the upper band in an uptrend can signal strength, not immediate reversal
repeated closes along the lower band in a downtrend can signal sustained weakness
a sharp move outside a band followed by immediate rejection may hint at short-term exhaustion
Bollinger Bands work especially well when combined with RSI or volume. For example, if price pushes into the lower band while RSI shows bullish divergence, that could strengthen the case for a bounce. If price breaks out of a squeeze and volume expands, that may support a momentum trade.
Limitations
Many beginners misuse Bollinger Bands by assuming every touch of the upper band means “sell” and every touch of the lower band means “buy.” In reality, strong trends can ride the band for extended periods.
The bands are best used as volatility context, not as automatic reversal signals.
How to Combine These Indicators Into a Swing Trading System
The reason these five indicators work well together is that they each answer a different question.
Moving Averages: What is the trend?
RSI: What is momentum doing?
MACD: Is momentum shifting or confirming?
Volume: Does the move have participation?
Bollinger Bands: Is volatility compressing or expanding?
That means a trader does not need to overload the chart. Instead, they can assign a role to each indicator.
A simple swing-trading framework might look like this:
Use the 50 EMA to define the broader trend.
Use support and resistance levels from price structure.
Check RSI to see whether momentum supports the trade idea.
Use MACD to confirm that momentum is turning in the expected direction.
Check volume to confirm breakout or continuation strength.
Use Bollinger Bands to assess whether volatility conditions support expansion or whether the market is already overstretched.
This kind of layered analysis is more effective than relying on a single signal. It also helps reduce impulsive trades.
Common Mistakes Swing Traders Make With Indicators
One of the biggest mistakes is using too many indicators. More tools do not always mean more clarity. Often they just create confusion, paralysis, or conflicting signals.
Another mistake is treating every indicator event as a trade signal. Not every RSI divergence matters. Not every MACD crossover deserves a position. Not every breakout candle should be chased.
Traders also often ignore the higher timeframe trend. They try to buy every dip even when the market is clearly weak, or short every rally while the broader trend remains strong. Indicators work better when aligned with overall structure.
Another common error is forgetting that indicators are interpretive tools, not prediction machines. They provide context, not certainty. Good traders use them to improve odds, not eliminate risk.
Finally, many traders fail because they focus too heavily on entries and too lightly on exits, stop-losses, and position sizing. A good signal with poor risk management can still become a bad trade.
Conclusion
Crypto swing trading is not about finding a magic indicator. It is about building a practical framework for reading trend, momentum, volume, and volatility with enough clarity to make disciplined decisions.
That is why these five indicators remain so useful. Moving Averages help identify the trend. RSI helps measure momentum. MACD helps confirm momentum shifts. Volume helps validate market conviction. Bollinger Bands help interpret volatility conditions.
Used together, they can give swing traders a more structured view of the market. Used carelessly, they can still produce confusion. The difference is not the indicator itself. The difference is how the trader uses it.
The best swing traders do not ask which indicator is perfect. They ask which tools help them stay consistent, manage risk, and make better decisions in a volatile market. That is the real edge.