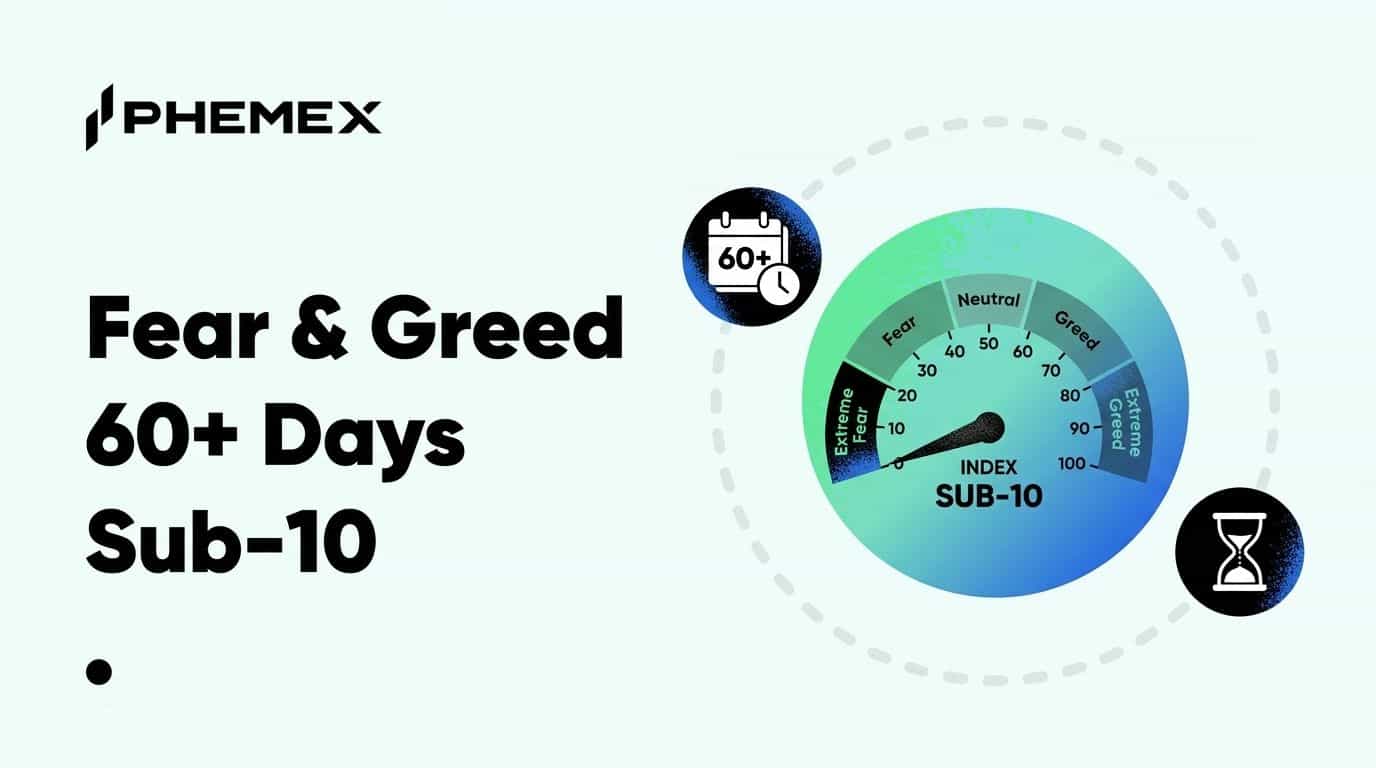
The Crypto Fear and Greed Index currently reads 8, and it has not printed above 10 for over 60 consecutive days as of late March 2026. That is not a typo. The index, which scores market sentiment on a 0-100 scale, has been stuck in single digits for more than two months straight, breaking the previous record by a factor of two. The longest prior sub-10 streak was roughly 30 days during the Terra/Luna collapse in summer 2022, and even the FTX implosion only produced about 15 consecutive days below 10.
What makes this streak different from every previous one is the catalyst. Every prior extreme fear episode was triggered by a crypto-native event, an exchange blowing up, a protocol collapsing, contagion spreading through lenders. This time the fear is coming from outside crypto entirely, driven by tariff escalation and global macro uncertainty that has nothing to do with blockchain infrastructure or exchange solvency.
What the Fear and Greed Index Actually Measures
The Crypto Fear and Greed Index aggregates five weighted inputs to produce a daily sentiment score from 0 (maximum fear) to 100 (maximum greed). Volatility accounts for 25%, measuring BTC drawdowns against 30-day and 90-day averages. Market momentum and volume contribute another 25%, social media sentiment across Twitter and Reddit adds 15%, Bitcoin dominance (rising dominance signals fear as capital flees altcoins) adds 10%, and Google Trends data for terms like "Bitcoin crash" rounds out the remaining 25%.
Source: Alternative
A score below 25 is classified as "extreme fear." Below 10 is territory the index has only visited during genuine market crises. For context, the index averaged roughly 22 during the March 2020 COVID crash and hovered around 10-15 for most of the 2022 bear market. Sustained single-digit readings for 60+ days is something the index has literally never done before.
The Complete History of Extended Sub-10 Streaks
Before the current streak, there were only two periods where the Fear and Greed Index stayed below 10 for more than a week. Both were tied to specific, identifiable crypto disasters that shook confidence to its foundation.
|
Period
|
Catalyst
|
Approx. Days Below 10
|
BTC Price at Start
|
30-Day Return
|
90-Day Return
|
180-Day Return
|
365-Day Return
|
|
Jun-Aug 2022
|
Terra/Luna collapse + Celsius/3AC contagion
|
~30
|
~$28,000
|
-15%
|
-5%
|
+2%
|
+45%
|
|
Nov 2022
|
FTX collapse
|
~15
|
~$20,500
|
+3%
|
+32%
|
+55%
|
+120%
|
|
Jan-Mar 2026
|
Tariff escalation + global macro
|
60+ (ongoing)
|
~$62,000
|
TBD
|
TBD
|
TBD
|
TBD
|
The pattern in the completed streaks is striking. Short-term pain was real, especially after Terra/Luna where BTC continued falling 15% in the first 30 days. But every single streak that ended produced outsized returns on a 90-day to 365-day horizon. The FTX streak, which was shorter and came after a deeper capitulation, produced the strongest returns at every timeframe, with BTC more than doubling within a year of the fear peak.
Why the Current Streak Is 2x Longer Than Any Previous One
The duration record matters because it reflects the nature of the underlying catalyst. Terra/Luna was catastrophic, but it was contained. Once the protocol collapsed, contagion spread through 3AC, Celsius, and Voyager over roughly six weeks, and then it was over. The fear had a definable endpoint because the damage was identifiable and finite. FTX was even more contained. The exchange went from rumors to bankruptcy in under two weeks, and while the fear was intense, the worst of the uncertainty cleared relatively quickly.
The 2026 tariff situation has no such clean resolution timeline. Trade policy escalation between the US and multiple trading partners has created rolling uncertainty where new announcements, retaliatory measures, and shifting negotiation positions keep resetting the fear clock every few days. Each new development extends the fear cycle rather than resolving it.
This is the core reason the streak has doubled the previous record. The catalyst is external, ongoing, and has no single resolution event that would let markets exhale. Previous crypto fears were acute shocks followed by recovery. This is a chronic condition, and the index reflects that difference.
What Extreme Fear Has Historically Meant for Forward Returns
The contrarian case for extreme fear as a buy signal has strong historical backing, but the nuance matters more than the headline. Looking at every instance where the index dropped below 15 for more than 5 consecutive days since the index was created in 2018, the average 12-month forward return for BTC has been approximately +85%. That number sounds compelling until you realize it includes the period from May 2022 to November 2022 where extreme fear was followed by even more extreme fear, and BTC fell another 40% before bottoming.
The honest read on the data is this. Extreme fear below 10 has always been a strong 6-to-12-month signal but a poor timing tool. Buying the day the index drops below 10 versus buying the day the streak ends has produced meaningfully different outcomes. The Terra/Luna streak saw BTC fall from $28,000 to $17,500 before recovery began, meaning someone who bought at the first sub-10 reading sat through a 37% further drawdown before seeing any gains.
Source: Coinmarketcap
The reason most traders fail to capitalize on extreme fear is not that they lack the signal. It is that they cannot tolerate the drawdown between signal and recovery. Recognizing "this will probably be higher in a year" is the easy part. Holding through another 20-30% decline in the interim is where conviction gets tested.
Why This Time the Resolution Depends on Washington, Not Crypto
Every previous extreme fear episode had a resolution mechanism built into the crypto ecosystem itself. Bad debt gets cleared, insolvent entities go bankrupt, and eventually the forced selling exhausts itself. The recovery timeline was driven by on-chain metrics like exchange reserves, stablecoin flows, and whale accumulation patterns that gave traders visibility into when the worst was over.
The current fear has none of those internal resolution signals because the problem is not internal. Tariff policy is decided in government offices, not on blockchains. The fear will persist as long as the trade conflict escalates or remains unresolved, and no amount of positive on-chain data (whale accumulation is actually strong, exchange reserves are declining, stablecoin supply is at all-time highs) has been enough to offset the macro overhang.
This creates an unusual setup where on-chain fundamentals look constructive by almost every historical measure while the sentiment index says the opposite. Bitcoin exchange reserves are at multi-year lows, stablecoin market cap has grown past $220 billion in dry powder, and institutional infrastructure (spot ETFs, custody solutions, regulatory frameworks) has only expanded since the last fear cycle.
The gap between fundamentals and sentiment is wider than at any previous fear extreme, and historically that gap has closed in favor of the fundamentals. The variable is how long macro uncertainty persists before that closing begins.
How to Think About Positioning During a Record Fear Streak
Dollar-cost averaging during extreme fear has been the highest-probability strategy across every completed fear cycle in crypto history. The approach works because it removes the impossible task of timing the exact bottom and captures the average price across the fear period instead. Someone who DCA'd weekly during the 2022 Terra/Luna fear streak had an average entry roughly 20% above the ultimate bottom but still captured the majority of the subsequent recovery.
Position sizing matters more than entry strategy here. The streak could extend further, and BTC could fall another 15-25% from current levels before the macro situation resolves. Small, regular purchases with capital you can afford to leave untouched for 12 months is a fundamentally different approach than levering up because "the index says it is time to buy."
And there is one scenario where the contrarian signal fails entirely. If the tariff conflict triggers a genuine global recession rather than a temporary growth scare, the recovery timeline would extend well beyond the 6-12 month window that previous cycles established. The base case is that extreme fear during a macro scare resolves similarly to prior cycles, but the tail risk is real and position sizing should reflect it.
Frequently Asked Questions
Has the Fear and Greed Index ever been wrong as a buy signal?
It has never been wrong on a 12-month horizon when the index stayed below 10 for more than a week, but it has been very wrong on shorter timeframes. Buying at the first sub-10 reading during the Terra/Luna collapse meant sitting through a further 37% decline before recovery began. The signal tells you the market is in a zone where long-term returns have been strong, not that the bottom is in today.
What would cause the Fear and Greed Index to reset above 10?
A meaningful de-escalation in US trade policy would be the most direct catalyst, since the tariff overhang is the primary driver of the current streak. Alternatively, a major positive crypto-specific development like spot ETF inflow records, a surprise rate cut, or a significant regulatory breakthrough could lift sentiment enough to break the streak even if macro tensions persist.
Is this a better buy signal than the 2022 extreme fear?
The on-chain fundamentals (low exchange reserves, record stablecoin supply, institutional infrastructure) are objectively stronger than they were in 2022. But the catalyst is harder to predict because it depends on geopolitical decisions rather than crypto-specific contagion that eventually self-resolves. The setup is arguably better for long-term buyers and worse for short-term traders.
Why is Bitcoin still above $60,000 if fear is this extreme?
Institutional holders, particularly spot ETF allocators, are not panic selling the way retail did in 2022. The fear is concentrated in retail and active trader sentiment while institutional flows have remained relatively stable. This structural bid from ETFs and corporate treasuries is providing a floor that did not exist in previous extreme fear periods.
Bottom Line
Sixty consecutive days below 10 on the Fear and Greed Index is a record that nobody wanted to set, and the fact that it keeps extending tells you the market has not found its catalyst for relief. The historical data from every completed extreme fear streak points to strong 6-to-12-month returns, with the FTX-era streak producing a 120% gain within a year. But this streak is driven by macro forces with no predictable resolution date, which means the timeline for recovery depends on trade policy developments that no chart or indicator can forecast. The smart positioning is gradual accumulation with position sizes small enough to survive another 20-25% decline, because every previous buyer during extreme fear was eventually rewarded, and the on-chain fundamentals suggest this time will not be the exception.
This article is for informational purposes only and does not constitute financial or investment advice. Cryptocurrency trading involves substantial risk. Always conduct your own research before making trading decisions.