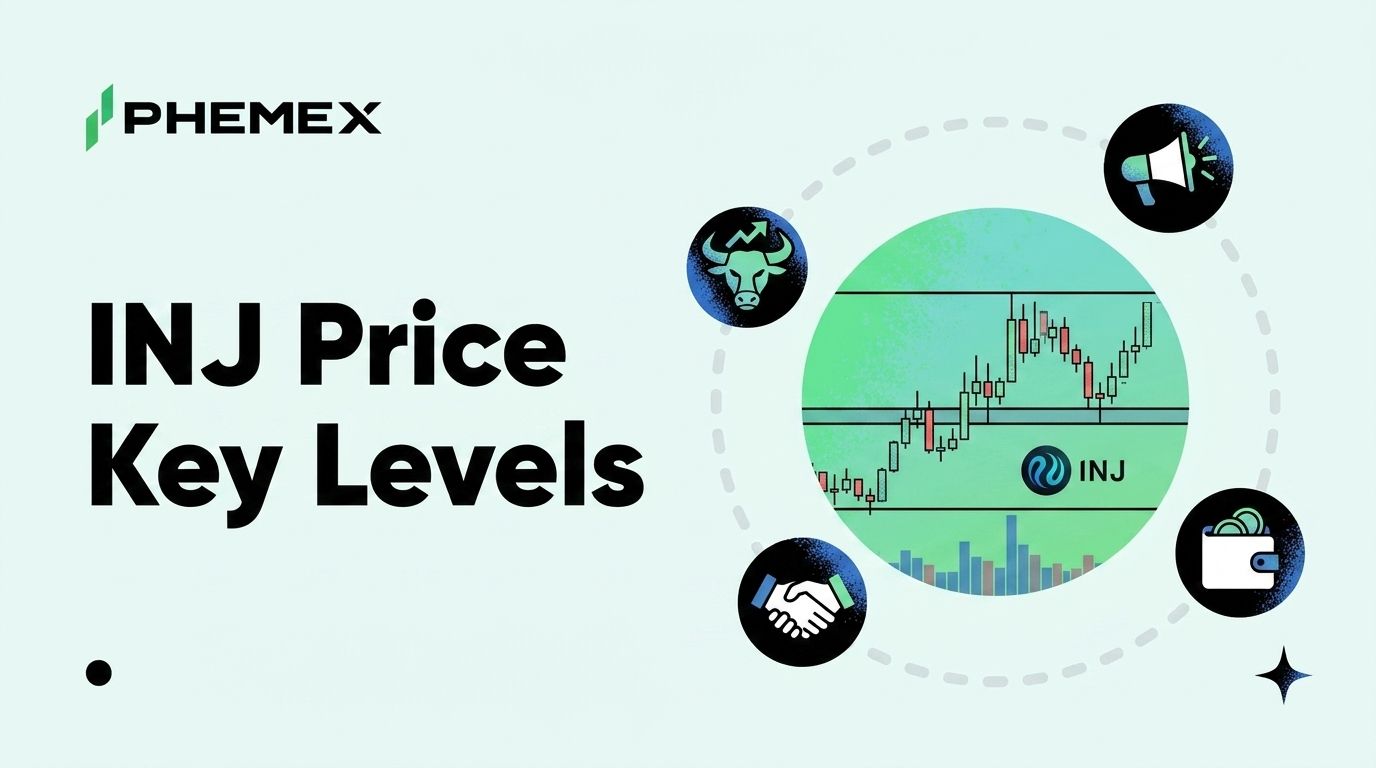
Injective (INJ) is consolidating in a roughly $10.40 to $12.20 range as of May 21, 2026, after a tight three-week base built on top of two catalysts almost nothing else in the L1 sector can match right now. Circle launched native USDC and CCTP on Injective on May 7. The May 6 Community BuyBack burned more than 55,000 INJ in a record-participation round. The 21Shares INJ spot ETF is sitting at the SEC. INJ is one of the only Cosmos-SDK chains with US-regulated futures live on a domestic venue.
The price is not reflecting any of that with a vertical move. It is doing something arguably more useful for a swing trader. It is holding a floor, refusing to break down with the rest of the market, and coiling against a clear horizontal ceiling.
The Current Setup and Why It Matters
INJ is the rare Layer-1 right now where token-level news is decisively bullish and macro is decisively bearish, and that tension is what produces tight, catalyst-loaded ranges like the one on the chart. Bitcoin is grinding sideways around $77,000 after breaking the level on May 18. Digital-asset ETPs posted roughly $1.07 billion in net outflows last week per CoinShares Digital Asset Fund Flows, the heaviest weekly figure since early 2025. Risk is being trimmed across the board.
Against that backdrop, INJ has not lost its post-BuyBack base. That is the entire story for the next two weeks.
The 30-day chart shows accumulation volume stepping up on every flush back into the $10.40-$10.80 zone, market cap in the $1.05-$1.20 billion range, 24-hour volume running $90-140M, and open interest on perp venues climbing without funding flipping aggressively positive. That is the technical signature of a base, not a top. The honest framing is that INJ has a clean bullish catalyst stack and a clean bearish macro tape, and the chart right now is saying the catalysts are doing their job.
The Support Map
There are three supports worth watching and they sit in a tight stack, which is what makes the setup tradeable.
$10.40 to $10.80 is the primary base. This is the post-BuyBack consolidation floor and where every flush over the last 14 sessions has been bought back within hours. The volume profile shows the heaviest acceptance node of the last month sitting inside this zone. If you are looking for an asymmetric entry, this is where the market has repeatedly told you it wants to defend.
$9.80 is the secondary line. This is where the late-April pivot low formed and where the 50-day moving average is climbing into. A wick into $9.80 that gets bought within the same daily candle keeps the structure intact. A daily close below $9.80, especially on rising volume, is something different. That tells you the BuyBack floor has stopped holding bids and the macro risk-off is bleeding into INJ specifically.
$8.40 is the structural invalidation. This is the February swing low and the level where the entire post-Circle integration thesis on the chart breaks. Below $8.40 the next visible buyer cluster on the historical volume profile sits closer to $7.20. There is no reason to be long INJ if $8.40 fails on a closing basis.
The point of stacking supports rather than picking one is that real markets give you tiered information. A wick into $10.40 tells you the base zone is still being defended, a close below $9.80 is a structural warning, and a break of $8.40 means the trade is over.
The Resistance Map
The ceiling is where most of the energy in this range is concentrated, because every catalyst sitting under the chart wants to push price through it.
$12.20 is the immediate cap. This is the level INJ has tested and rejected from three times in the last 12 sessions. It lines up with the pre-BuyBack supply cluster and with a high-volume node from the March distribution. The first sustained daily close above $12.20 with volume confirms the range is breaking up rather than continuing to coil.
$13.80 is the breakout target zone. This is the measured move from the base and roughly where the late-March supply that has not yet been absorbed begins. Most of the air pocket on the chart sits between $12.20 and $13.80, which means a break of the immediate cap tends to move quickly toward this level rather than grinding.
$15.40 is the upper liquidity pocket. This is the level where a confirmed ETF approval or a second wave of stablecoin-driven flow would be expected to attract resting size. Above $15.40 the chart opens up considerably because INJ has not traded with sustained acceptance up there since the prior cycle high.
And then there is the longer-term reference at $24, the prior-cycle high that traders will start citing the moment the ETF gets a date. That is not in play for this week, but it is in play for the multi-week setup if the catalyst stack converts.
The Circle USDC and ETF Stack as a Fundamental Floor
Price levels are useless without the question of what is putting bids underneath them. For INJ, three identifiable catalysts are doing that work.
Circle's May 7 launch of native USDC and CCTP on Injective is the most important of the three because it changes the chain from an L1 with bridged USDC into an L1 with first-party stablecoin infrastructure. Derivatives venues, market makers, and institutional desks have a hard policy line against bridged stablecoins for size, so with CCTP live, Injective is now a destination for flow that previously could not arrive.
The May 6 monthly Community BuyBack burned more than 55,000 INJ in a single round, the highest participation since the program launched. The mechanical effect on circulating supply is modest in any single round, but the signal effect on demand from a record-participation print is what matters here. It tells you the holder base believes the catalysts coming in the next two quarters are worth locking up float for, which is exactly the on-chain behavior that builds the kind of floor we are watching at $10.40.
The 21Shares INJ spot ETF filing is the wild-card catalyst sitting in the SEC queue. INJ approval is not priced into the chart in any visible way. If it lands, the gap between price and catalyst closes fast. If it does not land in this window, the floor still holds on the USDC and BuyBack work alone. INJ also has US-regulated futures live on a domestic venue, which gives institutional desks a hedging instrument they cannot get for most L1s.
The Macro Headwinds You Cannot Ignore
Everything above is the bull case. The bear case is sitting in the macro tape and it is not subtle.
BTC sideways at $77,000 after breaking the level is not bullish for high-beta L1s, and the week's $1.07 billion in net ETP outflows is the heaviest reading since early 2025. Inflation prints and the US-Iran ceasefire uncertainty are keeping the safe-haven bid alive in gold and short-duration Treasuries, neither of which helps crypto risk appetite.
If BTC loses $77,000 with conviction and grinds toward $72,000-$74,000, INJ does not get to stay in its range on the strength of token catalysts alone. Correlation will pull it lower. The token-specific floor is real, but it is not a force field, which is why the support map matters more than the resistance map for risk sizing right now.
You can be right on the token and still get stopped out on the index.
Breakout vs Breakdown Scenarios and Risk Management
This is the part of the analysis that matters most, because the levels above are only useful if they connect to a plan.
The breakout scenario. A daily close above $12.20 on volume opens the path to $13.80 as the first measurable target, with $15.40 as the extended target if the ETF news lands within the same window. Confirmation is straightforward. Hold above $12.20, no immediate rejection back into the range on the following session, and rising open interest without funding spiking above 0.05% on major perps. If those three boxes check, the range break is real.
The breakdown scenario. A daily close below $9.80 with rising volume invalidates the post-BuyBack base and opens $8.40 as the next visible support. If $8.40 fails, the next defended zone sits closer to $7.20. INJ has wicked into the low end of the range three times in the last two weeks without confirming a break, which is the kind of false signal that punishes traders who chase the spike rather than wait for the close.
The base case. Continued $10.40-$12.20 chop with the range tightening as either the ETF news or the next BuyBack round arrives in early June. This is the highest-probability path on a two-week timeframe given the macro tape, and it is the scenario where position sizing matters most. Coiling ranges produce false breakouts in both directions, and trading inside the range with tight invalidation tends to print better than chasing the eventual real break.
On sizing, if you are long INJ at $10.80 with a stop at $9.80 that is roughly a 9% risk per unit, so size the position so a stop-out costs you a number you would accept being wrong about. Read Phemex's guide on leverage trading before sizing up. The mistake most retail traders make in setups like this is not picking the wrong level, it is putting too much capital behind the right one.
Frequently Asked Questions
What is the most important level on the INJ chart right now?
$10.40 to $10.80 on the downside and $12.20 on the upside. The base zone is where the post-BuyBack accumulation has been happening, and $12.20 is the lid that has rejected three times. The first daily close on either side of those levels is the actionable signal.
Does the Circle USDC launch actually move INJ price?
Not directly and not immediately. What it does is open the door to institutional and market-maker capital that will not touch bridged stablecoins, and that flow shows up over weeks and months rather than days. It is part of why the $10.40 floor has held through a heavy outflow week in the broader market.
Will the 21Shares INJ ETF be approved?
The honest answer is that nobody knows the timing or the outcome with any precision. The SEC has been working through a queue of altcoin ETF filings since the March 17 commodity classification, and INJ is in that queue. An approval would be a clean upside catalyst. A denial, if it came, would test the $9.80 secondary support. Neither outcome is priced into the chart in any obvious way right now.
How should I think about trading INJ futures versus spot?
Futures give you the leverage and the ability to short if the range breaks down, but they also give you funding cost and liquidation risk on a token that can wick aggressively against the macro tape. For traders who want catalyst exposure with less path risk, spot accumulation in the $10.40-$10.80 zone with a defined invalidation below $9.80 tends to produce a cleaner sleep-at-night profile than levered perps inside a coiling range.
Bottom Line
The trade is the range until the range breaks. A daily close above $12.20 opens $13.80 and then $15.40 if the ETF news lands in the same window. A daily close below $9.80 opens $8.40 and then $7.20, with the wicks meaning nothing and only the closes mattering. The base case is continued chop into the early June catalyst window with the range tightening from both sides.
Watch the close, not the wick. Size the position for the macro, not only the token. And do not confuse a strong fundamental floor with an unbreakable one. If BTC loses $77,000 with conviction, INJ follows regardless of how good the catalyst stack looks on paper.
This article is for informational purposes only and does not constitute financial or investment advice. Cryptocurrency trading involves substantial risk. Always conduct your own research before making trading decisions.