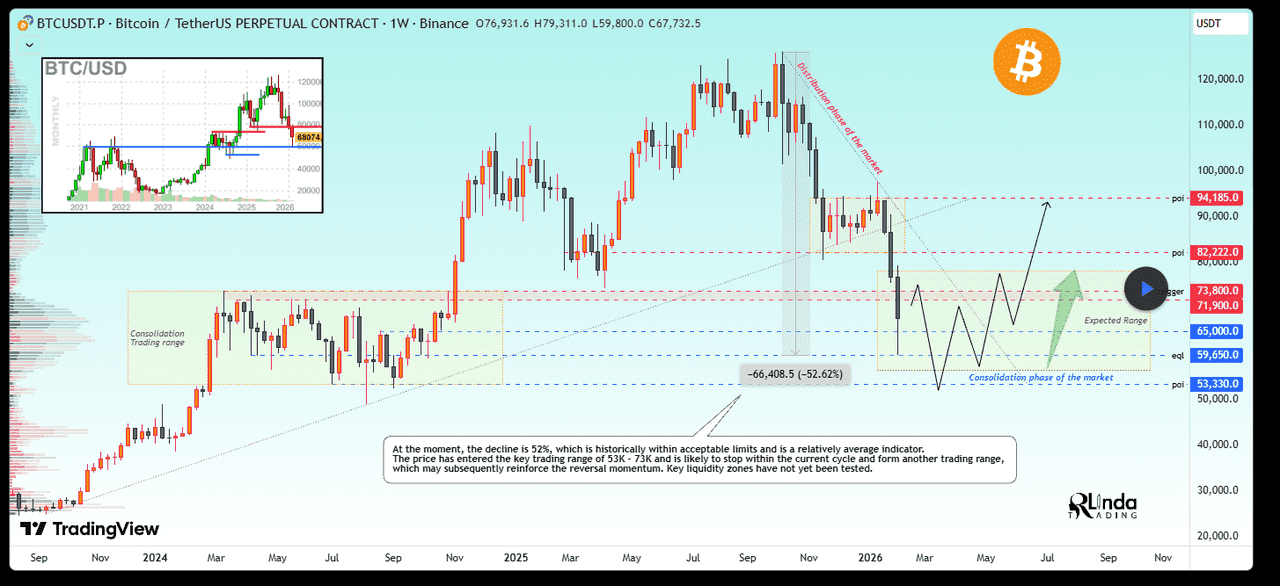
Bitcoin lost nearly 50% of its value in four months. From a record high above $126,000 in October 2025, Bitcoin (BTC) dropped to $60,062 on February 6 before rebounding above $68,000 heading into this week. The sell-off wiped out more than $500 billion in crypto market capitalization and triggered over $16 billion in liquidations across major exchanges.
This was not a gradual fade. The first five days of February alone saw a 30% decline, forced liquidations exceeding $2.5 billion in a single day, spot Bitcoin ETF outflows surpassing $1.5 billion, and the Crypto Fear & Greed Index dropping to 11. That is the lowest fear reading since the FTX collapse in 2022.
For traders looking at the week of February 10-16, the question is if BTC found a short-term floor, or is more downside ahead?
Where Does Bitcoin Stand Right Now?
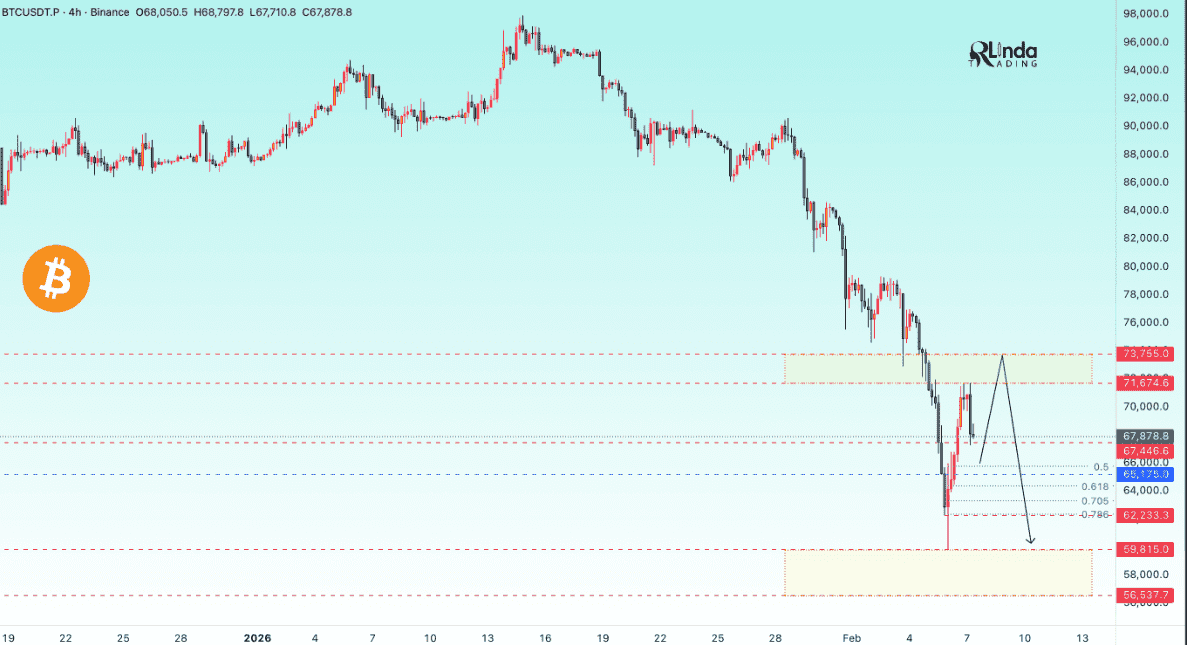
BTC closed the week of February 2-8 at approximately $68,400, recovering from the $60,062 intraday low on February 6. Friday's bounce back above $70,000 came alongside a broader risk-on move in equities, with the S&P 500 gaining 1.4% and the Nasdaq up 1.5%.
The rebound was sharp but comes with caveats. Volume on the bounce was high ($90 billion in 24-hour crypto trading volume), which suggests legitimate buying interest. But the rebound stalled below the $72,000-$73,000 resistance zone that multiple analysts have flagged as the first level bulls need to reclaim.
Metric | Value (Feb 8-9, 2026) |
BTC Price | ~$68,400 |
All-Time High (Oct 2025) | $126,000+ |
Drawdown from ATH | ~46% |
Weekly Change | -10.6% |
February Drawdown | ~30% |
Crypto Fear & Greed Index | 14 (Extreme Fear) |
24h Trading Volume | ~$52 billion |
BTC Market Cap | ~$1.37 trillion |
Circulating Supply | 19.985 million BTC |
The macro backdrop remains hostile. The Fed held rates at 3.50-3.75% in January, with JPMorgan projecting no cuts through 2026. Kevin Warsh's nomination as Fed Chair has added uncertainty. Treasury Secretary Bessent's February 4 testimony, where he rejected government authority for crypto bailouts or strategic BTC purchases, was the trigger that accelerated the sell-off from $80,000 into the $60,000s.
What Do the Technical Indicators Say?
Every major technical signal is bearish on the daily timeframe. Shorter timeframes show oversold conditions that historically precede relief rallies, but the longer-term structure has not stabilized.
Here is a breakdown of the key indicators as of February 8-9:
Indicator | Daily | Weekly | Signal |
RSI (14-day) | ~33 (approaching oversold) | Below 40 | Bearish, but nearing bounce territory |
MACD | Bearish crossover, histogram expanding down | Bearish | Sustained downside momentum |
20-day EMA | ~$86,100 (far above price) | N/A | Strong resistance overhead |
50-day EMA | ~$89,200 | Sloping down | Bear trend confirmed |
100-day EMA | ~$93,300 | Sloping down | Bear trend confirmed |
200-day EMA | ~$97,500 | Still rising | Long-term trend weakening |
365-day MA | Broken below (first time since March 2022) | Broken | Major bearish signal |
Bollinger Bands | Price touching lower band | Widening | Extreme volatility |
The 365-day moving average break is significant. CryptoQuant noted BTC has declined 23% in the 83 days since breaking below this level, which is worse than the early 2022 bear phase. The last time BTC traded below its 365-day MA was March 2022, and it took nine months to reclaim it.
RSI on multiple platforms reads between 28-33 on the daily chart. Investtech's analysis from February 8 shows RSI below 30, indicating "strongly negative short-term momentum" but also noting that low RSI in large-cap assets often signals oversold conditions and potential for a reaction upward.
One positive divergence: RSI is diverging positively against price on some timeframes. Price made new lows, but RSI did not, which can signal weakening selling momentum and a potential bounce.
What Are the Key Support and Resistance Levels This Week?
The levels to watch have shifted dramatically from where they were even two weeks ago. Here is a simplified map for the February 10-16 trading week:
Level | Type | Why It Matters |
$60,000-$61,000 | Major Support | February 6 intraday low; 200-week MA zone; aligns with CoinDesk's "realized price" floor |
$65,000-$66,000 | Minor Support | Thursday February 5 crash low; psychological level |
$68,000-$70,000 | Current Range | Where BTC consolidated over the weekend; key psychological zone |
$72,000-$73,500 | First Resistance | IG's resistance area; must be reclaimed for any sustained bounce |
$75,000-$76,000 | Resistance | Pre-crash support turned resistance; Polymarket's most likely end-of-February level (54% probability) |
$79,000-$81,000 | Strong Resistance | Bitcoin Magazine's weekly outlook resistance; former $84K support now acts as ceiling |
$84,000-$86,000 | Major Resistance | Previous support zone; 20-day EMA sits here; reclaiming this would shift short-term bias |
The $60,000 floor is where multiple data points converge. Stifel has modeled that BTC could sink as low as $38,000 based on prior cycle data if the downturn continues, but the 200-week moving average near $58,000-$60,000 has historically acted as a cycle bottom marker. One CoinDesk analyst pointed to this level as matching Bitcoin's "realized price," meaning the average cost basis of all holders.
On the upside, $75,000 is the level Polymarket traders assign the highest probability for BTC's end-of-February price (54%). Getting there from current levels would require a 10% move. Not impossible given recent volatility, but it would likely need a macro catalyst.
What Is Driving Sell Pressure This Week?
The February sell-off was not a single-event crash. It was a cascade of reinforcing factors that fed on each other.
ETF Outflows: U.S. spot ETFs have been net sellers in 2026. From November 2025 through January 2026, the ETF complex lost approximately $6.2 billion in net capital, the longest sustained outflow streak since these products launched. BlackRock's IBIT alone saw $528 million in outflows on one of the heaviest days. The average entry price for ETF holders is estimated at $81,600, meaning the average institutional ETF buyer is now underwater. This creates potential for further forced selling.
Liquidation Cascade: Over $16 billion in leveraged positions were liquidated in under 10 days. On the worst single day (February 5), $2.58 billion was wiped out, with 93% of liquidated positions being longs. Open interest collapsed to $103 billion, and funding rates flipped negative, a classic sign of bearish sentiment dominance.
Macro Headwinds: Fed rates remain elevated at 3.50-3.75% with no cuts expected. U.S.-Iran tensions pushed investors into traditional safe havens. Gold ran to $4,900+ while BTC fell 40%, further damaging the "digital gold" narrative.
Gold vs. BTC Divergence: This is a structural concern. Gold is up over 60% year-over-year while BTC is down nearly 40% over the same period. The divergence challenges Bitcoin's store-of-value thesis and has shifted analyst framing from "when will BTC rally" to "can BTC rally without abundant liquidity?"
What Are Analysts Saying About This Week?
Analyst consensus is split between those who see a tradeable bottom forming and those who expect further downside before stabilization.
Source | Outlook | Key Level / Target |
CoinCodex | Bearish short-term | $72,000-$77,250 range for week of Feb 10-16 |
CoinDCX | Bearish, potential recovery band | $72,000-$82,000 by Feb 9-15 |
Citi (Alex Saunders) | Bearish below $70K | Further downside if $70K breaks again |
Stifel | Bearish cycle risk | Could reach $38,000 if downturn continues |
CoinShares (Butterfill) | Cautious, H2 recovery | $120,000-$170,000 for full year 2026 |
Standard Chartered (Kendrick) | Bullish long-term | $150,000 year-end target maintained |
Canary Capital (Olszewicz) | Bear market until Q4 | Stabilization at $50,000-$60,000 around 200-week MA |
Polymarket traders | Neutral-bearish | 54% chance BTC at $75,000 by end of February |
The week of February 10-16 has one specific catalyst on the calendar: the U.S. CPI release (expected around February 10-14). Inflation data will directly impact rate cut expectations and risk appetite. A lower-than-expected print could spark a relief rally.
A hotter print would reinforce the "higher for longer" narrative and likely push BTC back toward the $60,000 support zone.
How Should Traders Approach This Week?
The data paints a picture of extreme fear meeting oversold technical conditions. That combination has historically produced sharp counter-trend rallies, even within larger bear markets. But it has also preceded further legs down when macro conditions remained hostile.
Here is a framework for reading the week:
Bullish case for a bounce: RSI below 30 with positive divergence. Record-high entity-adjusted realized loss ($3.2 billion on February 5) suggests capitulation. Extremely compressed sentiment (Fear & Greed at 11-14). Friday's rebound showed legitimate buying volume. Historical February average returns are +14.3%.
Bearish case for continuation: All EMAs stacked above price in bearish alignment. 365-day MA broken for the first time since March 2022. ETF holders underwater at average $81,600 entry, creating overhang. No positive macro catalysts on the immediate horizon. Open interest collapse suggests institutions are stepping away, not stepping in.
The pragmatic read: This is a week for levels, not predictions. If BTC holds above $65,000 and reclaims $72,000-$73,500, a move toward $75,000-$78,000 becomes the base case. If BTC loses $65,000 again, the $58,000-$60,000 zone is the next test, and that level will define if this is a deep correction or the start of a prolonged bear market.
For traders managing positions in this environment, the tools matter as much as the analysis. Tight stops, proper position sizing, and platforms with deep liquidity are non-negotiable during this level of volatility.
Phemex offers BTC/USDT perpetual contracts with up to 100x leverage, sub-millisecond order matching, and 24/7 liquidity across spot and derivatives markets. The platform processes up to 300,000 transactions per second and maintains a dual-price mechanism designed to prevent unnecessary liquidations during flash wicks like the ones seen on February 5-6.
Frequently Asked Questions
What is Bitcoin's price right now in February 2026?
BTC is trading near $68,400 as of February 8-9, 2026. It hit an intraday low of $60,062 on February 6 before rebounding. The price is down approximately 46% from its October 2025 all-time high of $126,000.
Why did Bitcoin crash in February 2026?
Multiple factors converged: Treasury Secretary Bessent rejected crypto bailouts during congressional testimony, spot ETF outflows exceeded $1.5 billion in one week, $16 billion in leveraged positions were liquidated, and broader risk-off sentiment from elevated rates and U.S.-Iran tensions pushed investors out of crypto.
What are the key Bitcoin support levels to watch?
Immediate support sits at $65,000-$66,000. The $60,000-$61,000 zone is where the 200-week moving average and realized price converge, making it the most significant floor. Analysts at Stifel warn of $38,000 if the broader downturn continues along historical cycle patterns.
Is Bitcoin in a bear market?
By most technical definitions, yes. A 46% drawdown from the all-time high, broken 365-day moving average, negative funding rates, and sustained ETF outflows all point to bear market conditions. CoinShares' Butterfill and Canary Capital's Olszewicz both expect the bear phase to last through Q3-Q4 2026 before recovering.
Will Bitcoin recover in 2026?
Long-term analyst targets remain bullish. Standard Chartered maintains a $150,000 year-end forecast. CoinShares expects $120,000-$170,000 with stronger price action in H2. Polymarket traders assign only a 23% probability to BTC falling below $55,000, suggesting the market believes the floor is relatively close. Recovery timing depends heavily on Fed policy, ETF flow stabilization, and the Clarity Act's progress toward providing regulatory certainty.
How can I trade Bitcoin during high volatility?
Use platforms with deep liquidity, tight spreads, and anti-liquidation mechanisms. On Phemex, BTC/USDT perpetuals run 24/7 with a dual-price system that protects against flash-wick liquidations. Position sizing and stop placement matter more than direction calls in this environment.
Bottom Line
Bitcoin is in its steepest correction since FTX. Every daily-timeframe technical indicator is bearish. But RSI is approaching levels that have historically preceded short-term bounces, and the Friday rebound showed real buying interest. The $65,000-$73,500 range is the battleground this week. Above $73,500, bulls get breathing room toward $75,000-$78,000. Below $65,000, the $58,000-$60,000 floor gets tested. CPI data will be the week's swing factor.
Trade the levels. Manage the risk.
This article is for informational purposes only and does not constitute financial or investment advice. Cryptocurrency trading involves substantial risk of loss. Always conduct your own research before making trading decisions.