

Trendline indicators are one of the most common and useful ways to examine price performance of stocks or crypto, helping traders to formulate a trading strategy with increased confidence and safety. One of these trendline indicators is the Accumulative Swing Index (ASI).

What Is The Accumulative Swing Index (ASI)?
The Accumulative Swing Index (ASI) is a trendline indicator commonly employed by traders to measure the long-term effects of a security’s price trend, based on opening, closing, high, and low prices. The aim is usually to determine whether or not the signals that are used to identify the trend point towards a good time to buy or a good time to sell. Analysts can usually do this by studying historical price charts, and using the data obtained to determine the way the current market is likely to behave in the future.

Who Invented the Accumulative Swing Index Indicator?
The Accumulative Swing Index Indicator was developed by American mechanical engineer and real estate developer J. Welles Wilder Jr. However, he is best known for his work in technical analysis. His seminal work is the New Concepts in Technical Trading Systems, published in 1978. He later published three other notable works; The Adam Theory of Markets or What Matters Is Profit (1987), The Wisdom of the Ages in Acquiring Wealth (1989) and The Delta Phenomenon: The Hidden Order in All Markets (1991).
Wilder’s work on technical analysis is among the most lauded in financial history. As well as pioneering the design of both the SI and ASI indicators, his work has also produced the popular Relative Strength Index (RSI), as well as the average directional index, the Parabolic Stop and Reverse (SAR) and the Average True Range (ATR).
“Somewhere amidst the maze of open, high, low and close prices is a phantom line that is the real market. The ASI attempts to show this real market.” – J. Welles Wilder
ASI vs SI: How Does the ASI Compare with the Swing Index (SI)?
The Accumulative Swing Index (ASI) is a variation of the Swing Index (SI) model. The SI is one of the most popular indicators used on the market to this very day, functioning as a price predictor, and therefore mostly used for futures trading. While SIs also examine highs, lows, opening, and closing prices to build a statistical model of a price’s performance, the key difference is the timeframe it uses for that analysis. The SI indicator is largely used to illustrate differences in an asset or security’s price during consecutive days, and usually over a relatively short span.
ASIs, however, are used to examine those same indicators, but during the current and any number of previous trading days. This will usually incorporate longer periods of time than an SI, allowing analysts to make note of any increase/decrease in price through a series of successive additions or subtractions.
This makes the Accumulative Swing Index (ASI) strategy particularly useful for swing trading, as one might expect from the name alone. Swing trading refers to a style of trade made in an attempt to capture short-to-medium term gains when trading an asset or security, by examining small changes in price direction. This can be a good indicator of a mini-trend forming, in either direction, which can be useful over a period of days, or even weeks in some extreme cases.

How to Use The ASI Indicator?
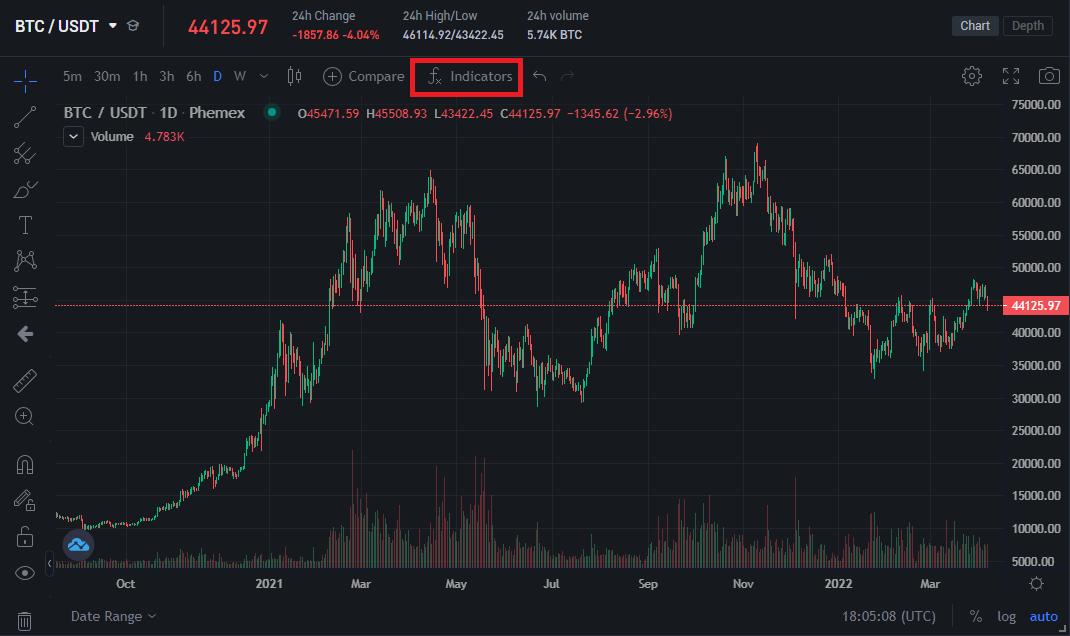
Let’s use the Phemex platform to get started. Pick among hundreds of trading pairs on the “Markets” tab. For this demonstration, we’re going to use the BTC/USDT chart. Click on the “Indicators” dropdown at the top and click on “Accumulative Strength Index” to activate it at the bottom of the price chart:
The ASI appears as a trendline:

The ASI fluctuates between positive and negative values. If the long-term trend is going up, the accumulative swing index will be denoted as a positive value, and vice versa–if the long-term trend is going down, the accumulative swing index will be denoted as a negative value. If the long-term trend is going sideways, that means the market is indecisive i.e. non-trending.
Common Accumulative Swing Index Strategies
An ASI indicator shows technical support/resistance levels, and provides confirmation of trends once the price breaks through either one of those levels. As such, the ASI indicator is commonly used for swing trading, as mentioned earlier.
When using the ASI indicator for swing trading, the more important data points are:
- Support levels: Support is the level at which a price’s downwards trend can be expected to pause, or even reverse, based on a perceived concentration of demand. When the price of an asset or security, such as a cryptocurrency, drops, demand for shares of that commodity will typically increase. This forms a support line, and when a price reaches this line it can signal a good time to buy in, or what is known as an entry point. However, this is dependent on the market, historical data, and the trading strategy one takes.
- Resistance levels: Resistance is the level at which a price’s upwards trend can be expected to halt, based on an elevated quantity of selling interest. When the price of an asset or security, such as a cryptocurrency, rises, the demand for shares of that commodity will typically decrease, just like any physical good. This forms a resistance line, and when a price reaches this line it can signal a good time to sell off, or what is known as an exit point. Again, this is also dependent on the market, historical data, and the trade strategy you intend to employ.
Once price reaches an area of support or resistance, it will usually do one of two things; either bounce back (reversing a price’s current trajectory), or break through the support/resistance level, creating a new level of support or resistance in the process. This is what makes swing trade the single most useful form of ASI indicator strategy, as these levels are instrumental in helping a trader identify buy/sell points for short, or even medium, term trading. ASI indicators, as the name suggests, enable traders to study this data in an accumulative manner.

Conclusion
While the ASI indicator may not be one of the most commonly used indicators on the market, or even one of the most commonly used indicators invented by Mr. Wilder, this does not diminish its utility in certain situations. Most indicators have an area of analysis that they are best suited for, and in this regard the ASI indicator is no different from any other (for example, swing trading, as we saw above). This is why it’s almost always useful to use indicators in conjunction with each other, as this allows a trader or analyst to formulate the most accurate and suitable strategy, according to their needs.
Read More
- What Is True Strength Index (TSI): Crypto Divergence & Trend Trading
- What is Trend Strength Index (TSI): How To Measure Trend Strength of Bitcoin
- Swing Trading Crypto: What are the Best Indicators for Swing Trading?
- What Is SMI Ergodic Indicator: Confirm Trends For Risky Trades
- What is RSI: How To Trade Bitcoin With The RSI Indicator
- What is Swing Trading in Crypto & How does it Work?
- How to Implement Swing Trading Strategies
- What is Mass Index (MI): The Best Reversal-Trading Indicator for Crypto