
Key Takeaways
Bull flags and bear flags are continuation patterns, not reversal patterns; they suggest the prevailing trend may resume after a brief pause.
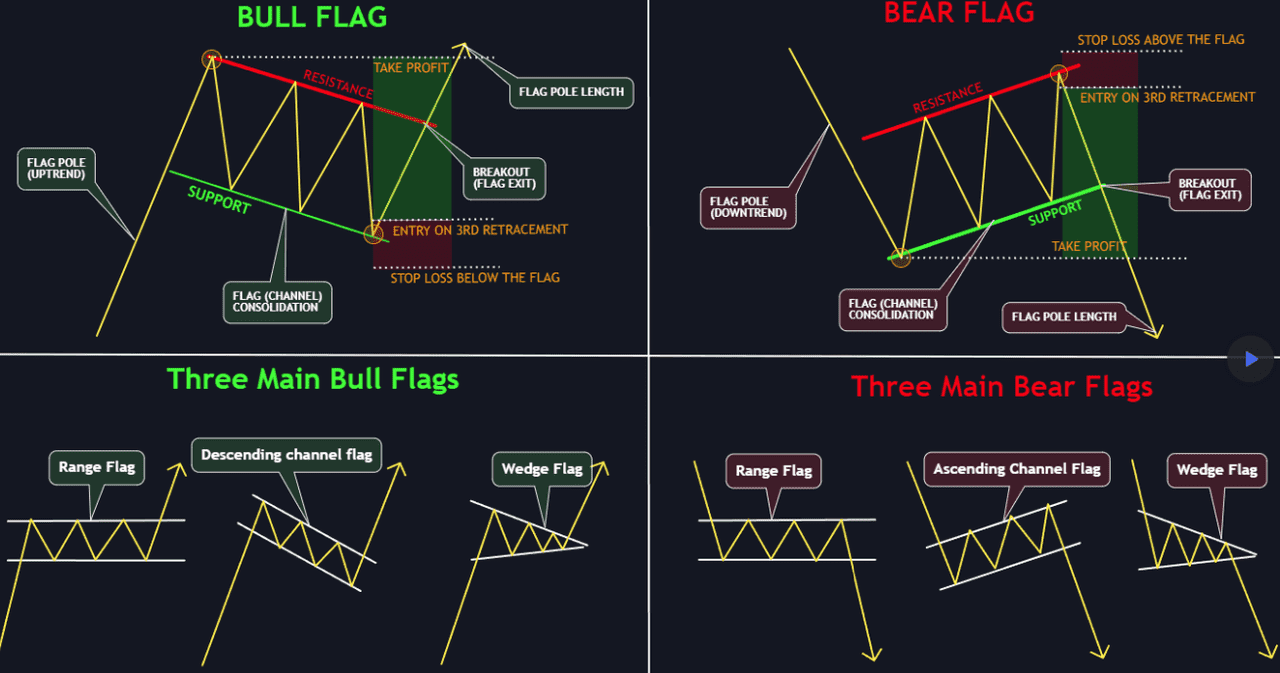
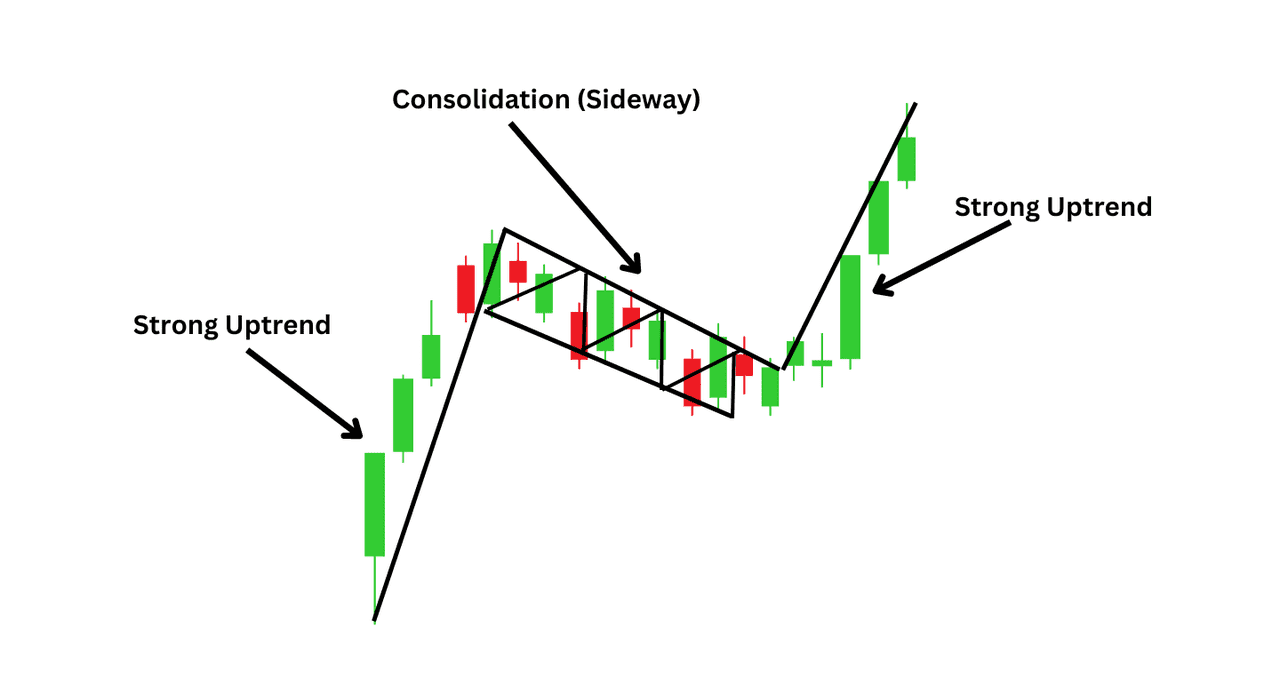
A bull flag usually forms after a sharp rally, followed by a small downward-sloping or sideways consolidation. A bear flag forms after a sharp drop, followed by a small upward-sloping or sideways consolidation.
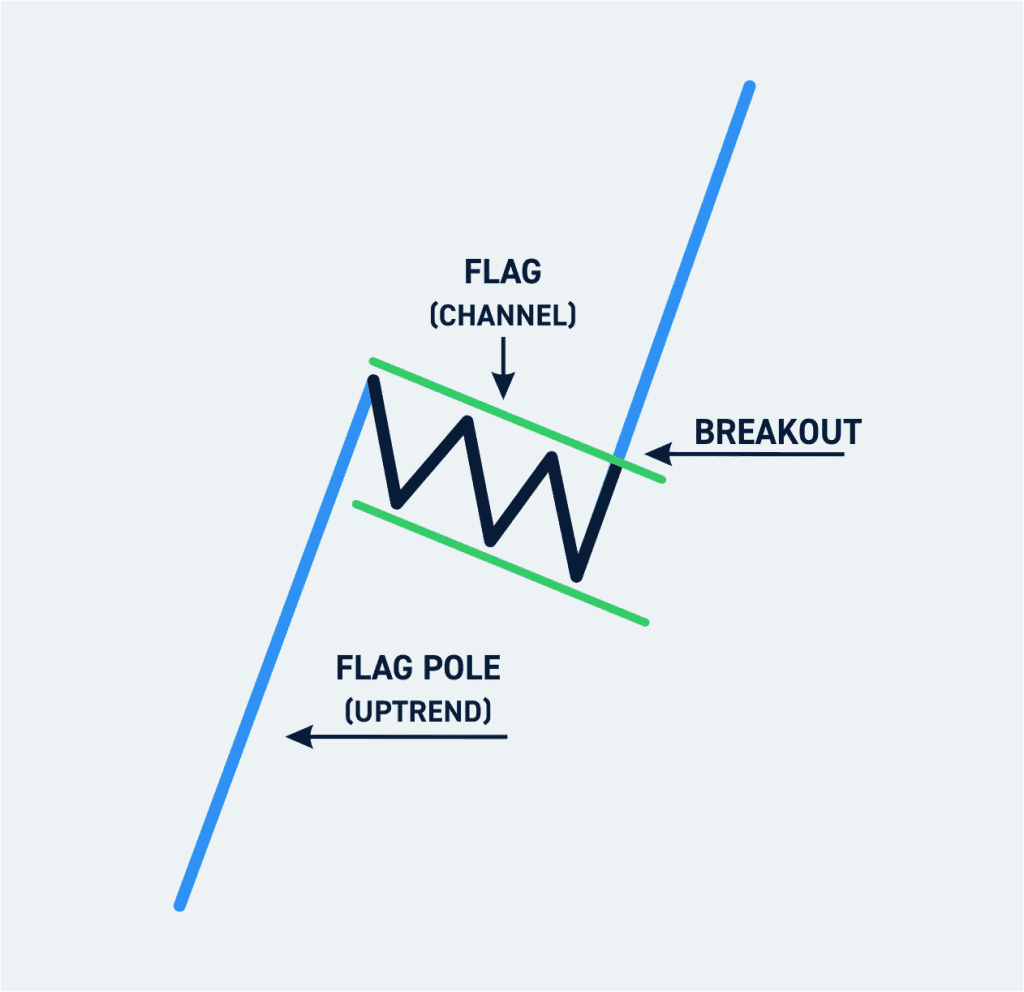
The classic flag structure has three parts: the flagpole, the flag, and the breakout or breakdown.
Volume often expands during the flagpole, contracts during consolidation, and expands again at the breakout, making volume one of the most important confirmation tools.
Traders usually improve outcomes by combining flag patterns with trend context, momentum confirmation, and strict risk management, rather than trading every visual setup automatically.
Flag patterns remain some of the most recognizable continuation setups in technical analysis. They are simple enough for newer traders to understand, but still useful enough for experienced traders to build into a rules-based strategy. In crypto, where trends can move fast and pauses can be brief, bull flags and bear flags matter because they help traders distinguish between a healthy consolidation and a real trend failure.
At a high level, a bull flag is a bullish continuation pattern. It typically forms after a strong upward move, followed by a short consolidation that slopes slightly downward or moves sideways before the uptrend resumes. A bear flag is the inverse: a strong downward move, followed by a short upward or sideways consolidation before the downtrend continues.
What makes flag patterns so useful in crypto is not that they predict every move perfectly. It is that they create a framework. Traders can identify the prior impulse, measure the consolidation, define a breakout or breakdown trigger, and map invalidation levels in advance. In 2026, that kind of structure matters more than ever because crypto markets are crowded, fast, and full of false breaks. A pattern is only valuable if it helps traders make more disciplined decisions, not just prettier chart annotations.
What Is a Flag Pattern?
A flag pattern is a continuation formation built from two main components: a strong directional move and a short consolidation channel. Investopedia describes flags as continuation patterns constructed with two parallel trendlines that can slope up, down, or sideways, while newer references summarize the structure as flagpole → flag → breakout.
The flagpole is the initial impulse move. In a bull flag, that impulse is upward. In a bear flag, it is downward. The flag is the consolidation phase that follows. This consolidation tends to be relatively short compared with the prior move and often drifts against the direction of the main trend. Finally, the pattern resolves with a breakout in a bull flag or a breakdown in a bear flag, ideally in the same direction as the original impulse.
The psychology behind the pattern is intuitive. After a sharp move, some traders take profits while others wait for a better entry. That pauses momentum without fully reversing it. If the pause stays controlled and the broader trend remains intact, the market often resumes its original direction. That is the basic idea behind both bull and bear flags.
What Is a Bull Flag?
A bull flag is a bullish continuation pattern that forms after a strong rally. Investopedia describes it as a vertical rise followed by a horizontal or downward-angled consolidation before another upward move. IG similarly explains that a bull flag often appears in an uptrend as a slow consolidation lower after an aggressive move higher, suggesting momentum remains positive.
In practical terms, traders usually look for three things in a bull flag:
A clear, forceful rally that creates the flagpole.
A contained pullback or sideways drift that forms the flag.
A breakout above the upper boundary of the flag, ideally with stronger volume.
The smaller and more orderly the pullback, the stronger many traders consider the pattern. A deep or messy retracement can weaken the setup because it suggests buyers may not actually be in firm control. That is why not every pause after a rally deserves to be called a bull flag. The shape matters, but so does the quality of the move.
What Is a Bear Flag?
A bear flag is the bearish mirror image. It starts with a sharp drop, then forms a short consolidation that usually tilts slightly upward or moves sideways, before the market breaks lower again. Investopedia describes a bear flag as a downtrend with increasing volume followed by a short upward consolidation with decreasing volume until the downtrend resumes. Axi similarly defines it as a minor pause in a downward trend, consisting of a straight-line selloff followed by a limited-range consolidation.
Traders usually look for the same three-part structure:
A steep decline that forms the flagpole.
A controlled bounce or sideways pause that forms the flag.
A breakdown below the lower boundary of the flag, ideally with renewed selling pressure.
Bear flags can be especially useful in crypto because downtrends often include short squeezes and reflex bounces that tempt traders to call the bottom too early. A proper bear flag helps frame those bounces as potential pauses rather than automatic reversals.
Bull Flag vs Bear Flag: The Core Difference
The core difference is direction. A bull flag forms in an uptrend and points to possible continuation higher. A bear flag forms in a downtrend and points to possible continuation lower. The consolidation phase often drifts slightly against the main trend: downward or sideways for bull flags, upward or sideways for bear flags.
That sounds simple, but traders still confuse the two because not every channel after a move is a flag. The pattern must appear after a meaningful impulse. Without a strong flagpole, the setup loses its context. A sideways channel in the middle of a random chop is just noise. The flag’s value comes from being a pause inside a bigger directional move.
The Three Parts of a Flag Pattern
The Flagpole
The flagpole is the initial burst of momentum. This move should be clear, directional, and relatively forceful. In crypto, that could come from a breakout above resistance, a liquidation cascade, a major news reaction, or a momentum expansion in an already-trending market. Educational references consistently treat the flagpole as the move that gives the whole pattern meaning.
The Flag
The flag is the consolidation channel that follows. It is usually short-lived and bounded by roughly parallel lines. The channel may slope slightly against the prior move or remain nearly horizontal. Flags can slope up, down, or sideways. A bull flag often consolidates lower and a bear flag often consolidates higher.
The Breakout or Breakdown
The pattern resolves when price exits the flag in the direction of the original trend. For a bull flag, that means breaking above the flag. For a bear flag, that means breaking below it. Many traders want to see renewed volume at this point, because a low-conviction break is more vulnerable to failure.
Why Volume Matters So Much
Volume is one of the most widely cited confirmation tools for flag patterns. Across multiple references, the typical profile is:
Higher volume during the flagpole,
Softer volume during the consolidation,
And stronger volume again on the breakout or breakdown.
This volume profile makes sense. The flagpole reflects urgency. The flag reflects a pause. The breakout reflects renewed commitment. If a bull flag breaks upward without much volume, traders may question whether buyers really support the move. If a bear flag breaks downward on weak participation, the move may be more vulnerable to reversal. Volume does not guarantee success, but it helps filter low-quality setups.
How Traders Confirm Bull Flags and Bear Flags in 2026
By 2026, most traders no longer rely on a chart pattern alone. The stronger approach is confluence: using the pattern together with trend analysis, momentum tools, and risk rules.
A practical confirmation checklist includes:
Is there a real flagpole, or is the move too weak to matter?
Is the flag relatively tight and orderly?
Does volume contract during consolidation?
Does the breakout or breakdown happen with stronger participation?
Is the setup aligned with the higher-timeframe trend?
Some traders also layer in moving averages, RSI, or lower-timeframe structure. The moving-average alignment can help confirm continuation after a breakout. That kind of extra filter can reduce the temptation to trade every pattern that looks approximately right.
How to Trade a Bull Flag
A common bull-flag workflow looks like this:
First, identify a strong prior rally. Second, draw the flag boundaries around the consolidation. Third, wait for the price to break above the upper trendline. Fourth, look for stronger volume or other confirmation. Fifth, place a stop below the flag structure or below a recent swing low, depending on strategy.
A traditional price target is often based on the height of the flagpole projected upward from the breakout point. Investopedia’s bull-flag discussion explicitly references the flagpole-height projection as a common objective. That does not mean price must reach that target, only that it provides a structured way to think about reward relative to risk.
How to Trade a Bear Flag
The bearish version uses the same logic in reverse. Traders identify the initial selloff, draw the consolidation channel, and then watch for a breakdown below the lower boundary of the flag. A stop is often placed above the flag or above a recent swing high, again depending on risk tolerance and timeframe.
As with bull flags, some traders project a downside target by measuring the flagpole and extending that distance from the breakdown point. The purpose is not precision down to the dollar. The purpose is to create a disciplined framework for whether the trade offers enough upside relative to the risk.
Common Mistakes When Trading Flag Patterns
One of the biggest mistakes is forcing the pattern. Traders often draw flags where none exist, especially in choppy crypto conditions. Without a clear flagpole and orderly consolidation, the setup is usually weak.
Another mistake is ignoring volume. If the breakout lacks participation, the pattern may fail. Many low-quality trades come from entering too early or assuming every boundary break will turn into a real continuation move.
A third mistake is trading against context. A bull flag inside a larger downtrend can fail. A bear flag inside a strong higher-timeframe uptrend can also fail. IG and other trading references stress the importance of respecting the prevailing trend.
The last mistake is weak risk management. Even reliable continuation patterns fail sometimes. That is why stops and position sizing matter more than the visual appeal of the setup.
Bull Flags and Bear Flags in Crypto Specifically
Crypto makes flag patterns both attractive and dangerous. They are attractive because digital-asset markets trend hard and often create textbook-looking impulse-and-pause structures. They are dangerous because 24/7 trading, thinner liquidity in some pairs, and liquidation-driven spikes can create false breaks that look convincing at first. That is why modern traders tend to combine the pattern with volume, momentum, and broader market context instead of treating it as a standalone entry signal.
This matters especially for BTC, ETH, and high-beta altcoins. A bull flag on Bitcoin may behave differently from a flag on a thinly traded altcoin. The cleaner and more liquid the market, the more reliable many traders consider classic technical setups. In lower-liquidity names, pattern quality can deteriorate faster. That is an inference based on the general role of liquidity and false-break risk in technical trading rather than a rule unique to one source.
Conclusion
Bull flags and bear flags remain useful in 2026 because they translate momentum into structure. A strong move, a controlled pause, and a continuation break is one of the simplest recurring behaviors in markets. That is why these patterns keep showing up in technical-analysis education across older references and newer trading guides alike.
The real edge is not in spotting the flag before everyone else. It is in trading it better. That means demanding a real flagpole, respecting volume, waiting for confirmation, and defining risk before entering. In crypto, where false breaks are common and volatility is relentless, that discipline matters more than pattern memorization.
Want to apply bull flag and bear flag analysis in live crypto markets? On Phemex, traders can monitor price action across spot and derivatives markets, study chart structure around breakouts and consolidations, and use order-management tools to build more disciplined strategies.