

Bitcoin is trading around $59,658, down hard from its earlier highs, and the Fear and Greed Index sits at 18, deep in "extreme fear." When a sell-off this sharp lands, one explanation keeps coming back. Crypto's 2026 weakness, the argument goes, is just the four-year cycle doing what it has always done. It is the recurring pattern that has shaped every Bitcoin bull and bear since 2013, and right now it points to one of the least comfortable parts of the loop.
The cycle is not magic and it is not a guarantee. It is a pattern tied to Bitcoin's supply schedule, market psychology, and the way liquidity moves through risk assets. Here is what the four-year cycle actually is, how the halving drives it, what past cycles tell us, and the honest debate over the pattern still working in an era of spot ETFs and institutional flows.
What the Bitcoin Four-Year Cycle Is and Why the Halving Drives It
The four-year cycle is the idea that Bitcoin moves through a repeating sequence of boom and bust roughly every four years. The anchor for that rhythm is the halving, a hard-coded event that cuts the rate of new BTC issuance in half about once every four years, or more precisely every 210,000 blocks.
Source: Fidelity
When Bitcoin launched, miners earned 50 BTC per block. That dropped to 25 in 2012, 12.5 in 2016, 6.25 in 2020, and 3.125 in 2024. Each halving slashes the new supply hitting the market while demand stays the same or grows, the supply mechanic Investopedia's Bitcoin halving entry breaks down in plain terms. Basic supply and demand does the rest. If buyers keep showing up while fewer coins are minted, price tends to rise, and the historical pattern is that the biggest rallies have followed the halvings by 12 to 18 months.
That supply mechanic is only half the story. The cycle is also a psychology engine. Rising prices pull in attention, attention pulls in capital, capital pushes prices higher, and the loop runs until it exhausts itself. Then it reverses. Greed turns to fear, leverage unwinds, and the market grinds lower until sellers are gone. The halving sets the tempo, but human behavior and liquidity amplify it into the swings traders remember.
If you want to study the long arc of these moves visually, the Bitcoin 200-week moving average has historically marked the floor of past bear markets, and the Bitcoin rainbow chart maps the same emotional extremes onto a color band.
The Four Phases of the Bitcoin Market Cycle
Traders usually break the cycle into four classic phases, borrowed from Wall Street's older market-cycle theory and adapted to Bitcoin. Each phase has a distinct character, a typical duration, and a behavior that traps the people who arrive late.
The table below lays them out in order, then the takeaway is simple. Most of the pain happens in markdown, and most of the easy money is made by the people who bought quietly during accumulation.
|
Phase
|
What happens
|
Typical sentiment
|
Where it sits in the cycle
|
|
Accumulation
|
Price is flat and boring after a crash. Long-term holders buy quietly.
|
Apathy and disbelief
|
Bottom, after the bear
|
|
Markup (bull)
|
Price trends up, breaks the old high, then accelerates.
|
Optimism turning to euphoria
|
The rally, often post-halving
|
|
Distribution (top)
|
Price chops sideways at highs. Early buyers sell into late buyers.
|
Euphoria and denial
|
The peak
|
|
Markdown (bear)
|
Price falls in waves, each rally failing lower.
|
Fear and capitulation
|
The decline
|
The hardest phase to trade is distribution, because it looks like a pause in the bull rather than the top. Price stays high, headlines stay positive, and retail keeps buying while smart money quietly exits. By the time markdown is obvious, the drop is already well underway. This is where most traders who chased the top get stopped out at a loss. Tools like bull market peak indicators exist precisely to flag the transition from markup to distribution before the markdown phase confirms it.
What Past Cycles Show and the Bears That Followed
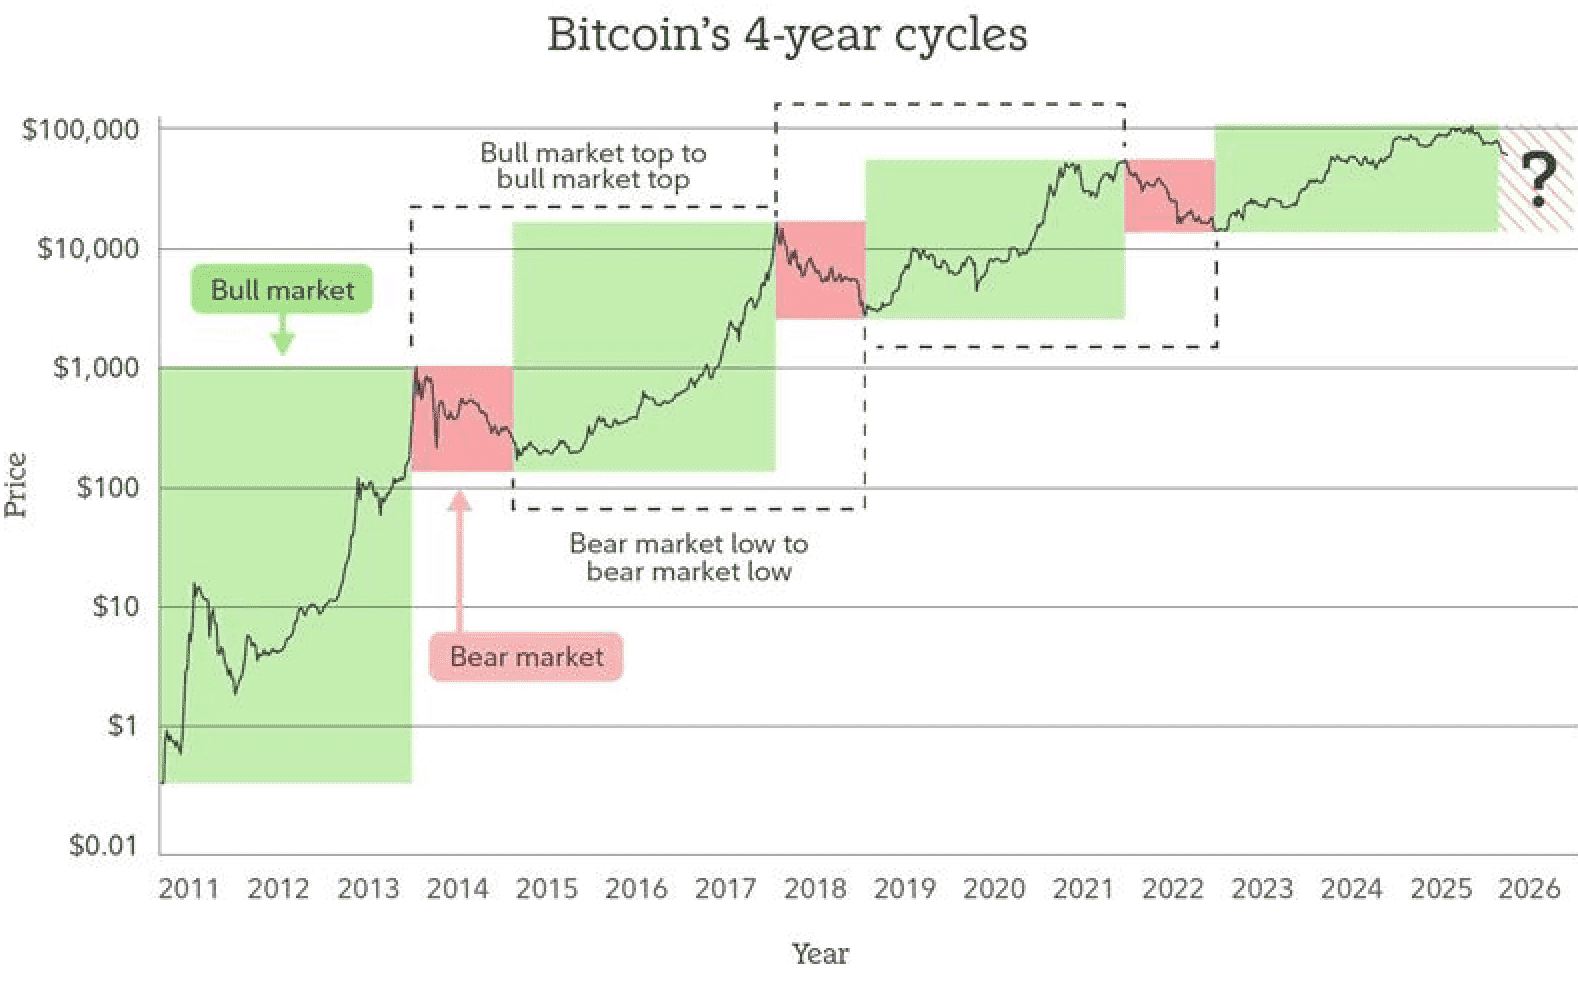
The reason traders take this pattern seriously is that it has repeated three times with eerie similarity. Each cycle produced a blow-off top roughly a year after a halving, then a brutal bear that erased most of the gains.
The 2012 halving was followed by a 2013 top near $1,100, then a bear that took Bitcoin down roughly 80% over the following year. The 2016 halving preceded the 2017 top close to $20,000, and the bear that followed cut price by about 84% into the December 2018 low near $3,200. The 2020 halving led into the 2021 top around $69,000, after which Bitcoin fell roughly 77% to the late-2022 low near $15,500.
Three things stand out across all three. The tops clustered 12 to 18 months after each halving. The drawdowns from peak to trough ran 77% to 85% every time. And each bear bottomed before the next halving arrived, resetting the loop. The full price history behind these turning points is mapped on CoinGecko's Bitcoin page, which charts every cycle high and low. That consistency is why so many traders treat the four-year clock as a real structural feature rather than coincidence, and why a deep 2026 drawdown gets read as the cycle once again running on schedule. For the full toolkit of on-chain and valuation models built around these turning points, the best Bitcoin valuation and analysis tools collect the indicators traders lean on at each phase.
Is the Bitcoin Cycle Dead or Just Changing
This is where honest analysis matters, because the cycle is not a law of physics and the case that it is weakening is real.
The "cycle is changing" argument rests on structural shifts. The 2024 spot Bitcoin ETF launches opened a steady institutional bid that did not exist in earlier cycles, and large allocators do not trade on halving folklore. As the asset matures and its market cap grows into the trillions, each new wave of buying moves price less in percentage terms, which should mute both the parabolic tops and the catastrophic bottoms. Several analysts argue the old "four-year clock" is being replaced by a longer, shallower cycle driven by macro liquidity and rate policy rather than the halving alone. The 2024 to 2026 cycle never produced the vertical blow-off of past tops, which some read as evidence the pattern is already softening.
The "cycle still works" camp pushes back. The current drawdown, with BTC near $59,658 and sentiment at an 18reading, looks a lot like the markdown phase that has followed every prior top. Supply issuance is still cut on schedule, retail psychology still swings from greed to fear, and leverage still unwinds violently when it does. From this view the cycle is not dead, it is just stretched and dampened by deeper liquidity, with the same four phases playing out on a flatter curve. The honest answer is that nobody knows which view wins until this cycle fully completes, and anyone claiming certainty is selling something.
Where 2026 Sits in the Pattern
Map the current setup onto the framework and 2026 lines up with a post-top markdown phase. The last halving was 2024, the cycle high formed and faded after that, and the market is now in a deep drawdown with extreme-fear sentiment. That is the textbook profile of a bear leg, the markdown that historically follows distribution.
What the pattern does not tell you is how deep or how long. Past markdowns ran 77% to 85% from peak, but if the institutional-bid thesis is right, this one could bottom shallower and turn faster than 2018 or 2022. Two anchors worth watching are the same ones that marked prior bottoms. The first is price holding or losing its long-term moving-average floor. The second is ETF flows turning from outflows back to steady inflows. Those signals, not the calendar alone, tend to mark the shift from markdown back to accumulation.
Frequently Asked Questions
What is the Bitcoin four-year cycle?
It is the recurring boom-and-bust pattern Bitcoin has followed roughly every four years, anchored to the halving that cuts new BTC supply in half. The cycle runs through four phases, accumulation, markup, distribution, and markdown, with major tops historically forming 12 to 18 months after each halving.
Is the Bitcoin cycle dead?
Probably not dead, but likely changing. Spot ETFs and institutional capital have added a steadier bid and a larger market cap, which should dampen the parabolic tops and deep bottoms of earlier cycles. The four phases still appear to play out, just on a flatter, possibly longer curve.
Where are we in the Bitcoin cycle right now?
The 2024 halving is past, the cycle high has faded, and Bitcoin near $59,658 with Fear and Greed at 18 fits a post-top markdown or bear phase. Historically this phase ends when sentiment bottoms and price stabilizes above its long-term moving-average floor.
What happens after the markdown phase ends?
The cycle resets into accumulation, where price goes flat and boring while long-term holders quietly buy. That phase has historically preceded the next markup leg, though the timing has never been precise and there is no guarantee past patterns repeat.
Bottom Line
The four-year cycle is a framework, not a forecast, and right now it points to the markdown phase, the bear leg that has followed every prior Bitcoin top. With BTC near $59,658 and Fear and Greed at 18, the current drawdown fits that read cleanly. The open question is depth. Past markdowns ran 77% to 85% from peak, but the spot-ETF era may produce a shallower, faster bottom that breaks the old script. Watch two things rather than the calendar. The first is price holding its long-term moving-average floor. The second is ETF flows flipping back to inflows. When fear is this extreme, the cycle says the bottom is closer than the top, but it never says exactly when.
This article is for informational purposes only and does not constitute financial or investment advice. Cryptocurrency trading involves substantial risk. Always conduct your own research before making trading decisions.