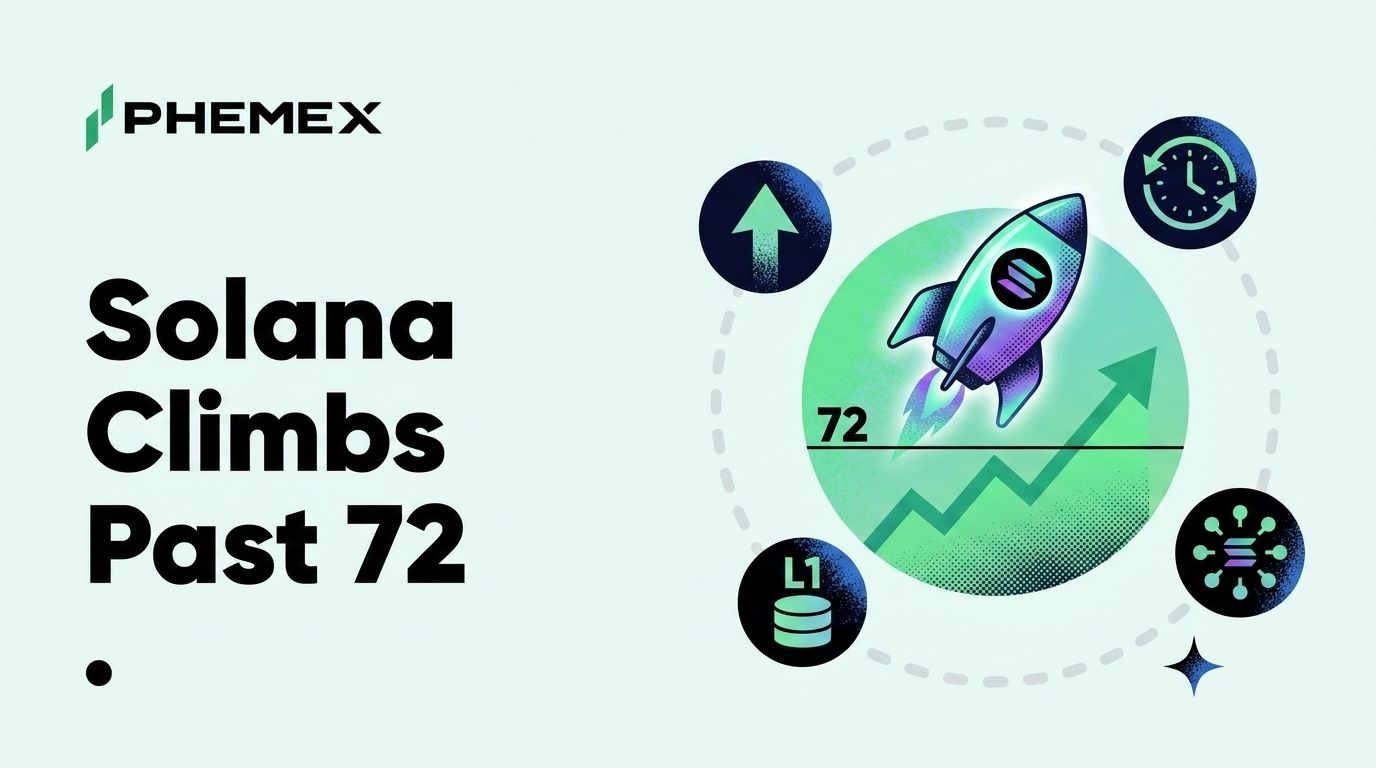
Solana trades at $72.93, up 2.81% on the day and back above the $72 line it lost during the early-June risk-off flush. The move rides the same Iran-ceasefire rally lifting the whole majors complex, with Bitcoin at $65,723 and Ethereumup 3.05% to $1,769. SOL is doing what it almost always does when fear drains out of the tape. It is leading the bounce as the highest-beta large-cap on the board.
That beta cuts both ways, and the honest read is that this reclaim is a macro trade first and a Solana-specific story second. Here is the breakdown.
Why Is Solana Rising Today
The bid under Solana is a risk-on rotation, not a network catalyst. The Iran truce pulled the geopolitical premium out of every risk asset this week, and when that fear unwinds, capital rotates back down the risk curve toward the assets that fell hardest on the way down. SOL sits at the front of that line among the majors, so it tends to fall faster in a panic and snap back faster in a relief rally.
The majors are moving as a block, which is the tell. BTC is up 0.36%, ETH up 3.05%, XRP up 2.94%, and SOL up 2.81%, all off a shared early-June low. When the whole complex turns together off one bottom, that is a market-wide sentiment shift rather than a single-coin narrative, and shifts like that tend to carry better than a one-asset pump. The reclaim of $72 puts SOL back inside the range it was knocked out of, which is the first step before any move toward the upper levels.
Snapshot as of this morning:
- SOL price: $72.93
- 24h change: +2.81%
- Key level reclaimed: $72
- Catalyst: Iran-truce risk-on rally + Solana on-chain activity
How SOL Trades Against ETH in a Risk Cycle
The cleanest way to understand SOL is as a leveraged bet on crypto risk appetite. It is a Layer-1 with deep retail flow, high on-chain turnover, and a beta to the broad market that runs well above the large-cap average. In practice that means SOL outperforms ETH and BTC when the tape is ripping and underperforms both when it rolls over.
This week is the up-leg version of that relationship. ETH is up 3.05% and SOL is up 2.81% on the day, but the comparison that matters is the round trip. SOL fell harder than ETH into the early-June lows, so its reclaim of $72 is a recovery of ground it gave up faster than the field, and traders holding it as their high-beta sleeve are getting exactly what they signed up for.
The practical takeaway is positioning, not prediction. SOL belongs in the aggressive part of a book when you want a bullish macro view with more torque than BTC gives you, and it is the wrong instrument when you want to ride out chop, because the same volatility that powers the up-moves punishes you on every shakeout. Knowing which regime you are in matters more for SOL than for almost any other large-cap.
The Levels That Matter From Here
SOL is back above $72, but the map on either side decides if this reclaim is a base or a lower high. These are the lines to trade against.
|
Level
|
Role
|
What it means
|
|
$85
|
Continuation target
|
Next objective if the rally extends
|
|
$76–$78
|
Overhead resistance
|
Where prior bounces stalled and supply sits
|
|
$72
|
Reclaimed line
|
Now the level bulls must defend
|
|
$70
|
First support
|
Bounce zone on any pullback
|
|
$66
|
Invalidation
|
Loss here cancels the recovery thesis
|
The structure reads simply. As long as SOL holds $70 on a closing basis, the reclaim stays intact and dips are buyable against a clear stop. The real work sits at $76 to $78, the band that capped the prior recovery attempts and where trapped longs from higher prices wait to sell into strength. Clearing it on volume separates a relief bounce from a trend leg and opens the path toward the $85 continuation target.
A loss of $66 is the line that changes the story. A daily close beneath it would tell you the truce rally was a lower high rather than a bottom for SOL, putting deeper June support back in play. Until then, the burden of proof sits with the bears. Live price and 24-hour stats are tracked on CoinGecko's Solana page.
Why Solana's Ecosystem Still Underpins the Bid
The macro is driving the day, but the reason SOL gets bought aggressively in a relief rally is that the network has real usage behind it. Solana is the dominant venue for retail on-chain activity, and that activity does not switch off when price dips. It is the home base for memecoin speculation through the Pump.fun launchpad, and that single funnel keeps a constant stream of new tokens, new traders, and fee revenue flowing through the chain.
The numbers back the narrative. Solana routinely posts some of the highest decentralized exchange volumes in crypto, with Jupiter and Raydium handling order flow that rivals or beats every competing chain on busy days. Fast settlement and near-zero fees are the structural reason that flow lives on Solana rather than anywhere else, and that gives DeFibuilders a reason to keep shipping there. You can track total value locked and chain-level activity on DefiLlama's Solana page.
On-chain demand and token price do not always move together. When sentiment is poor, SOL can trade well below what its activity would justify, and when sentiment flips, the catch-up move is violent. The institutional layer adds a second leg. Ongoing SOL ETF speculation and treasury-company accumulation give larger allocators a regulated path into the asset, the same way the first wave of spot crypto ETFs reshaped demand for the assets above it.
The FOMC Risk Sitting Directly Ahead
Every long in this market needs to respect the June 17 FOMC sitting directly ahead. Markets are pricing roughly a 96% chance of a hold, so the rate decision itself is a non-event. The risk is the reaction, because high-beta assets like SOL move the most in either direction when the post-meeting positioning flush hits.
Crypto has a documented habit of selling off after FOMC prints even when the outcome is exactly what was expected, because the anticipation trade unwinds the moment the uncertainty premium evaporates. SOL amplifies that pattern. If BTC gives back 3% on a knee-jerk post-Fed dip, SOL can easily give back more, which is the cost of holding the highest-beta name into a binary event. You can watch where leverage is stacked and which side is overextended on CoinGlass liquidation data.
None of that makes the Fed a one-way bet against price. A genuinely dovish lean would let SOL hold its gains and press into the $76 to $78 band with the rest of the complex behind it. But treating a consensus hold as a reason to chase SOL into the print is how traders give back the easy part of this rally.
Scenarios Into the Back Half of June
The setup splits into two clean paths, and the FOMC reaction decides which one runs.
The bullish path runs through a dovish Warsh and steady ecosystem flow. If the Fed frames the next move as a cut toward neutral and Solana DEX volumes stay elevated, SOL defends $70 on any dip and grinds back toward $76 to $78, with a clean break putting $85 in play. In this path SOL keeps outperforming the majors, exactly as a high-beta L1 does when risk appetite is expanding.
The bearish path is the sell-the-news scenario. A neutral-to-hawkish hold triggers the familiar post-FOMC unwind, SOL loses $70, and the high-beta math accelerates the move toward the $66 invalidation, where a daily close flips the thesis back to deeper June support. The official Solana network resources and validator data live at the Solana project site.
The base case sits between the two. Expect an outsized post-FOMC reaction in either direction given SOL's beta, then a cleaner trend once the positioning resets.
Frequently Asked Questions
Why is Solana rising today?
The move is a risk-on rotation driven by the Iran ceasefire pulling the geopolitical fear premium out of markets, which sends capital back down the risk curve toward the assets that fell hardest. SOL is the highest-beta large-cap in the majors complex, so it leads these relief rallies, and it is climbing alongside BTC, ETH, and XRP off a shared early-June low rather than on a Solana-specific catalyst.
Will Solana go up in 2026?
The case rests on Solana keeping its lead in retail on-chain activity, DEX volume, and memecoin flow, plus the institutional layer of SOL ETF speculation and treasury-company buying. The honest answer is that nobody can promise a number, and SOL remains a high-volatility asset that can swing 20% in either direction on macro alone. It belongs in the aggressive sleeve of a portfolio, sized for the volatility that comes with the beta.
What is SOL's next resistance?
The first real ceiling is the $76 to $78 band, where prior recovery attempts stalled and overhead supply sits. A clean break above it on volume opens the path toward $85, the next continuation target. Below price, $70 is the support bulls need to defend and $66 is the invalidation level.
Is SOL a good risk-on trade?
SOL is one of the cleanest high-beta expressions of a bullish crypto macro view, because it outperforms BTC and ETH when risk appetite expands and the network's deep on-chain usage gives the rallies real fuel. The flip side is that it underperforms hard in risk-off, so it works best when you have conviction on direction and size the position for the swings rather than treating it like a core holding.
Bottom Line
Solana reclaimed $72 on the broad risk-on rally, but the next 48 hours belong to the Fed. Hold $70 through the June 17 print and the reclaim stays alive, with $76 to $78 the band that decides if this becomes a trend or a lower high, and $85the target on a clean break. Lose $66 on a daily close and the truce rally was a trap for SOL, with deeper June support the next stop. Respect the beta. SOL gives you more upside than BTC in this tape and more downside on any post-FOMC flush, so the cleaner entry usually comes after the knee-jerk dip rather than into it. The ecosystem flow is the floor under all of it, and as long as that on-chain demand holds, the dips are more likely to get bought than the strength chased.
Disclaimer: This article is for educational purposes only and does not constitute financial advice. Cryptocurrency and stock trading carries significant risk. Always do your own research and consult a qualified advisor.