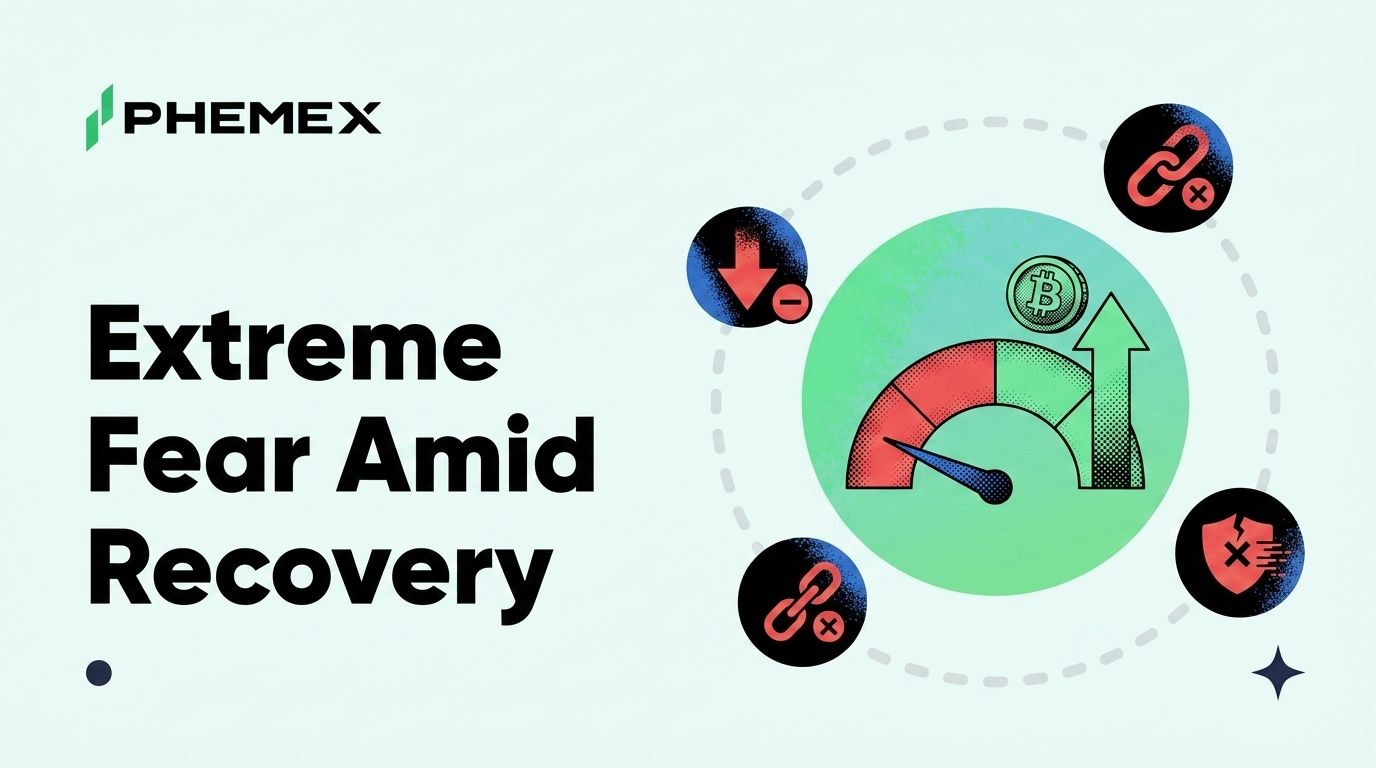
The Crypto Fear and Greed Index sits at 24, deep inside Extreme Fear, as of July 5, 2026. That reading has fallen from the 60 to 70 band it held in early June, a swing from comfortable optimism toward something close to capitulation in a matter of weeks. What makes the number odd is the price action sitting behind it. Bitcoin trades near $63,239 this weekend, up sharply from its June 30 low around $57,800, so the market is recovering while the collective mood keeps deteriorating.
Sentiment and price usually travel together, and when they split this widely the gap tells you something about how traders are actually positioned. Here is what the index measures, why fear can deepen while Bitcoin climbs, what Extreme Fear has meant in past cycles, and how to read it without treating it as a timing tool.
What the Fear and Greed Index Actually Measures
The index is a single 0 to 100 score that compresses several market signals into one emotional reading, where 0 is maximum panic and 100 is euphoric greed. Anything from 0 to 24 counts as Extreme Fear, and today's 24 puts the market right at the ceiling of that zone. The score is rebuilt every day and published by alternative.me, which remains the most widely cited version of the gauge.
The number is a weighted mix of inputs rather than a survey of opinions. Volatility carries roughly a quarter of the weight, comparing current price swings against the recent average. Market momentum and trading volume feed in another large slice, along with social media activity, Bitcoin's share of total market capitalization, and search trend data. When drops are sharp, volume thins, and the crowd goes quiet, the formula reads that combination as fear regardless of where price closes.
Think of it as a mood ring for the market, not a valuation model. It tells you how the average participant probably feels right now, which is useful precisely because feeling and fundamentals often disagree. The index says nothing about how Bitcoin works, what it is worth, or where it is headed. It only measures the temperature of the room.
Why Sentiment Stays Fearful While the Price Climbs
A 9% bounce off the lows does not erase the memory of the fall that came before it. Bitcoin shed close to $16,000 of value in the second half of June, and traders who bought near the highs are still underwater even after this recovery. Price has moved, but confidence has not caught up, and the index is built to track the second thing rather than the first.
The flow data explains most of the disconnect. Spot Bitcoin ETF flows remain negative by roughly $6.27 billion over the trailing 30 days, even after a +$223.5 million inflow day on July 2 snapped a ten-session outflow streak. One green day inside a month of red does not reverse a trend, and the ETF flow data still shows institutions net sellers over any meaningful window. Sentiment tools notice that backdrop even when the daily candle is green.
On-chain positioning reinforces the caution. More than half of all circulating Bitcoin is currently held at a loss, meaning the coins were acquired at prices above where the market trades today. Holders sitting on paper losses tend to sell into strength rather than add to it, which caps rallies and keeps conviction thin. A recovery built on short covering and bargain buying feels fragile from the inside, and the index reflects that fragility honestly.
What Extreme Fear Has Signaled in the Past
Historically, Extreme Fear readings have clustered near local bottoms far more often than near tops. The logic is simple enough. By the time the crowd is this frightened, most of the selling has usually already happened, which is why seasoned traders watch deep fear as a zone of interest rather than a reason to run. The table below shows how a few notable Extreme Fear episodes played out.
|
Period
|
Index low
|
Bitcoin context
|
What followed
|
|
March 2020
|
~8
|
~$5,000 during the COVID crash
|
Roughly tripled within six months
|
|
June 2022
|
~6 (near record low)
|
~$17,600 amid the Terra and lender collapse
|
Ground lower before the real bottom months later
|
|
November 2022
|
~20
|
~$16,000 as the FTX failure hit
|
Marked the cycle low, then doubled over the next year
|
|
August 2024
|
~17
|
~$49,000 during the carry-trade unwind
|
Recovered to fresh highs within months
|
The pattern favors patience, but the June 2022 row is the warning label. Fear was already extreme, and Bitcoin still fell another 10% before it found a durable floor. Extreme Fear told you the risk-reward was improving. It did not tell you the exact day to buy, and the difference between those two ideas is where most traders get hurt.
Where the Contrarian Read Breaks Down
The index is a sentiment gauge, not a bottom caller, and treating it as the latter is the fastest way to lose money to it. Extreme Fear can persist for weeks, and in a genuine bear market the reading can sit under 25 while price keeps grinding down. A score of 24 today is information about mood, not a countdown timer to a reversal.
The sample size also deserves respect. Crypto has only lived through a handful of full cycles, so every historical comparison rests on a thin record that can mislead as easily as it guides. A signal that looks reliable across four or five events is not the same as one tested across decades, and anyone quoting a precise hit rate is dressing up a small dataset as certainty.
There is a second failure mode worth naming. Because the index leans heavily on volatility and momentum, a fast recovery can flip it toward greed before the underlying picture actually improves, and a slow bleed can hold it in fear long after the smart money has repositioned. The reading lags reality in both directions, which is exactly why it works best as one input among several rather than a standalone trigger.
How to Use Extreme Fear Right Now
Treat the current 24 as a positioning gauge, not a green light. Deep fear is historically a better time to accumulate than to panic sell, so the reading argues against dumping a long-term position into weakness. It does not argue for backing up the truck with leverage on a Sunday bounce. The disciplined move is to scale in gradually if you were already planning to add, rather than trying to nail a single perfect entry.
Pair the sentiment score with hard confirmation before sizing up. The signals that would turn this recovery from a bounce into a trend are concrete. Watch for spot ETF flows to stay positive across multiple weeks rather than a single day, for the share of supply held at a loss to start falling, and for the index itself to climb back above 25 and hold there. Longer-term traders can cross-check the picture against structural markers like the 200-week moving average and a basket of on-chain valuation tools that describe value rather than mood.
The mirror image is just as useful. When this same index eventually pushes into Extreme Greed, that is the moment to tighten risk, and the indicators that flag market tops become the relevant checklist. Extreme Fear and Extreme Greed are two ends of the same tool. The reading is loudest, and most worth acting on, when the crowd is most convinced it is right.
Frequently Asked Questions
Is Extreme Fear a good time to buy crypto?
Historically it has been a better time to accumulate than to sell, because deep fear usually means most of the selling has already occurred. That said, the index is not a timing tool, and fear can stay extreme for weeks while price drifts lower, so scaling in beats trying to catch the exact bottom.
Why is the Fear and Greed Index low when Bitcoin is going up?
The index weights volatility, momentum, and volume heavily, so it reflects the recent shock more than the latest green candle. A single-week bounce off a sharp drawdown does not repair confidence, especially while ETF flows stay negative and most holders are still underwater.
What does a reading of 24 mean?
Any score from 0 to 24 is classified as Extreme Fear, and 24 sits at the top edge of that band. It signals that traders are cautious and risk-averse right now, which historically overlaps with local lows more often than with tops, though it guarantees nothing about the next move.
How often does the Fear and Greed Index update?
The reading is recalculated once every day from live market data, so the number you see this morning can differ from yesterday's. Because it refreshes daily and lags the underlying trend, most traders watch its direction over a week rather than reacting to a single print.
Bottom Line
The split between a 24 sentiment reading and a Bitcoin price recovering toward $63,239 is a positioning story, not a contradiction. Traders are still carrying the memory of a $16,000 June drawdown, still watching $6.27 billion of net ETF outflows over 30 days, and still sitting on coins bought higher, so the mood stays fearful even as the tape turns up. History says Extreme Fear tends to reward patience rather than panic, but the June 2022 episode is the reminder that fear can deepen before it lifts. The signal to watch is not the index in isolation. It is the index climbing out of Extreme Fear at the same time ETF flows string together positive weeks, and that combination has not arrived yet.
This article is for informational purposes only and does not constitute financial or investment advice. Cryptocurrency trading involves substantial risk. Always conduct your own research before making trading decisions.