





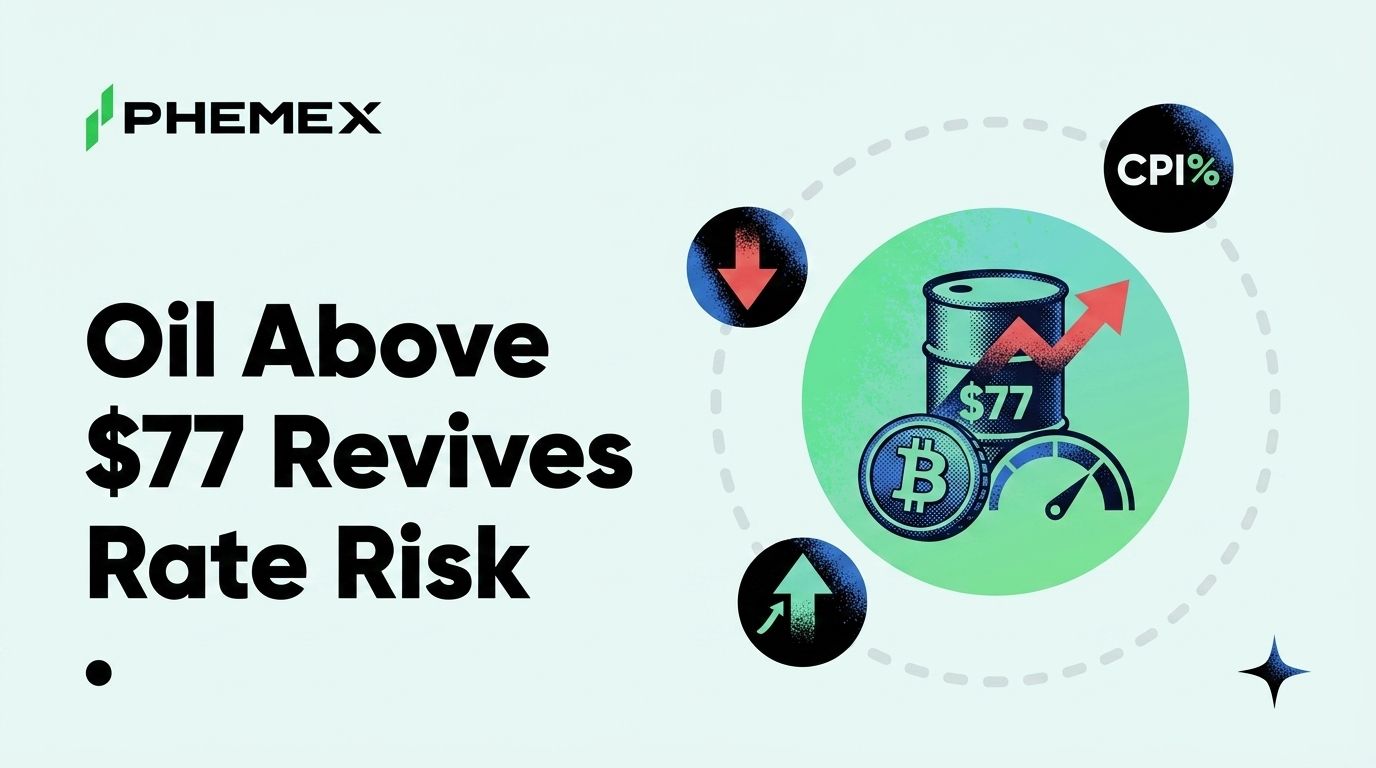
Bitcoin is trading around $63,387, down about 1% on the day, while Brent crude holds above $77 a barrel after briefly topping $80. The US-Iran ceasefire collapsed on July 8, 2026, when Trump declared it "over, as far as I'm concerned," and the energy market repriced war risk within hours. Bitcoin barely flinched by comparison, sliding roughly 2.5% to around $62,000 with a brief wick to $61,500 before it recovered most of the move.
That gap is the whole story. Crude moved something like six times more than Bitcoin on the identical headline, because the war premium concentrated in the commodity that physically transits the Strait of Hormuz. Bitcoin does not ship through Hormuz, and the market priced it accordingly.
BTC price. Roughly $63,387, holding the low-$63,000s after last week's flush.
24h change. Down 1%, a quiet tape relative to energy markets.
7-day path. Down to $62,000 on the July 8 headline, brief $61,500 wick, then a grind back toward $63,400.
Brent crude. Above $77 after a spike through $80, with WTI above the $72-$75 zone and at its highest since June 22.
Rate expectations. Prediction market Kalshi has 2026 rate-hike odds near 55%, and consumer inflation expectations sit at 3.7%.
Key level. $62,000 is the line that separates a routine geopolitical dip from a genuine macro repricing.
The oil spike still matters for Bitcoin, and it travels through inflation rather than through war headlines. Here is where BTC sits right now, why it held up better than crude, how a $77 barrel turns into rate-hike risk, and the levels that decide the next move.
What the Ceasefire Collapse Did to Oil and Bitcoin
The July 8 collapse was not a gradual deterioration. Trump publicly declared the arrangement finished, and within a single session Brent tore through $80 before settling into a range above $77, while WTI pushed above $72-$75 and printed its highest levels since June 22. The step-change is visible in the EIA's daily Europe Brent spot price series, and Trading Economics' crude oil page shows WTI holding the same elevated shelf rather than fading back.
Bitcoin's reaction was almost polite. BTC lost roughly 2.5%, touched $62,000, briefly wicked to $61,500 on thin overnight liquidity, and then spent the following sessions clawing back toward $63,400. There was no cascade, no multi-billion-dollar liquidation event, no follow-through selling on day two.
Traders who came into the week expecting a crypto crash on war headlines got the wrong asset. The energy market absorbed the shock, and Bitcoin traded like what it currently is in this cycle, a liquidity-sensitive risk asset rather than a wartime safe haven. The Phemex explainer on what Bitcoin is covers the supply mechanics behind the long-run thesis, though none of that moves the tape inside a 48-hour window.
Why Bitcoin Held Up Better Than Crude
A six-to-one move ratio is not random. Oil has a physical transmission channel to this specific conflict, and Bitcoin does not.
Roughly a fifth of the world's seaborne oil passes through the Strait of Hormuz. Any escalation that raises the probability of disruption there attaches a quantifiable premium to every barrel in the world, because the supply risk is real and the market can price it in dollars per barrel. Bitcoin carries no equivalent exposure, and no hashrate is bottled up in the Gulf, no meaningful share of BTC liquidity depends on tanker traffic, and no supply schedule changes because a ceasefire fell apart.
What Bitcoin does have is a second-order exposure, and that is where the risk actually lives. Higher crude feeds into headline inflation, higher inflation pressures the Fed, and a hawkish Fed drains the liquidity that has driven every meaningful BTC rally on record. The move is slower and it is indirect, but it is far more dangerous to a leveraged long than a one-day war headline.
Worth noting for anyone holding altcoins into this. Ethereum has historically fallen two to three times harder than Bitcoin during each flare-up of this conflict, which is the standard high-beta pattern in a risk-off tape. If you are sizing exposure around a macro event, the Phemex primer on Ethereum is a reminder that ETH's drawdown profile is structurally different from BTC's, and that difference shows up exactly when the tape gets nervous.
The Inflation Channel Is How Oil Actually Reaches Bitcoin
Here is the part most of the market keeps getting wrong this week. The trade is not "war equals Bitcoin down." The trade is "crude above $75 equals sticky inflation equals no rate cuts."
Energy is one of the most direct inputs into headline consumer prices, showing up at the pump, in freight, and in everything that has to be shipped. When Brent holds above $77 for weeks rather than days, the pass-through into the Bureau of Labor Statistics CPI release becomes arithmetic rather than speculation. That matters because the entire bull case for risk assets in the second half of 2026 was built on rate cuts arriving.
The Fed has already signaled it is watching. The FOMC minutes published on the Federal Reserve's calendar pageshowed most participants voicing concern about inflation rather than about growth, which is the tell for a committee that is not in a hurry to ease. Consumer inflation expectations, tracked in the New York Fed's Survey of Consumer Expectations, sit at 3.7%, well above the 2% target and high enough that policymakers worry about expectations becoming self-fulfilling.
Prediction markets have already made the leap. Kalshi has 2026 rate-hike odds sitting near 55%, which is a remarkable number given that the market spent the spring debating how many cuts it would get. A coin-flip probability of a HIKE is a completely different world for Bitcoin than a base case of two cuts, and the Phemex overview of prediction marketsexplains why those odds are worth watching as a live sentiment gauge rather than a forecast. Cross-check them against the CME FedWatch tool, which prices the same question off fed funds futures, and the direction of travel is the same.
Why This Week's CPI Print Decides the Next Move
Everything above collapses into one variable. If crude stays above $75 into this week's CPI print and the print comes in hot, the market's rate-cut hopes flip toward rate-hike risk, and Bitcoin has to reprice a materially tighter liquidity path.
A cool print does the opposite. It tells the market the oil move has not yet reached consumer prices, that the Fed can keep the door open, and that the $62,000 flush was a geopolitical head-fake rather than the start of a macro downtrend. The 55% hike odds compress fast in that scenario, and BTC gets room to work back toward the top of the range.
The honest answer on which way it breaks is that nobody knows, and anyone giving you a confident call on a single CPI print is guessing. Institutional flow is the confirmation layer here, and the Phemex guide to reading Bitcoin ETF flows is the fastest way to check if allocators are de-risking or simply sitting on their hands.
Bitcoin Price Levels and Scenarios to Watch
BTC is holding the low $63,000s with the July 8 low at $62,000 and the wick low at $61,500 as the reference points below. The scenario map below is what the CPI print resolves.
|
Scenario
|
Trigger
|
BTC implication
|
Level to watch
|
|
Cool CPI, crude fades
|
Print in line or softer, Brent back under $75
|
Hike odds compress, cut narrative survives
|
Reclaim $65,500 to confirm
|
|
Hot CPI, crude sticky
|
Print hot, Brent holds above $77
|
Rate-hike risk gets priced, liquidity path tightens
|
Lose $62,000 on a daily close
|
|
Escalation, no CPI shock
|
Fresh Hormuz headlines, print still tame
|
Volatility spike, BTC underperforms crude again
|
$61,500 wick low as the floor
|
|
Sustained oil shock
|
Brent through $80 and holding
|
Stagflation framing returns, ETH bleeds harder than BTC
|
$58,000 as the next structural shelf
|
The $62,000 level is the one that carries the most information. It is the July 8 panic low, it held on the first test, and a daily close beneath it would tell you the market is no longer treating this as a geopolitical blip. Above it, the range holds and the $65,500 reclaim is the bull's next task. The Phemex chart of the Bitcoin 200-week moving average gives you the longer-cycle floor for context, and it sits far enough below current price that this week's fight is a range fight, not a cycle fight.
Frequently Asked Questions
Does oil affect Bitcoin?
Not directly, and the July 8 move proved it. Crude moved roughly six times more than BTC on the same headline because oil carries the physical supply risk and Bitcoin does not. Oil reaches Bitcoin on a delay, through headline inflation and the interest-rate path that inflation forces on the Fed.
Will the Fed hike rates in 2026?
Prediction market Kalshi puts 2026 hike odds near 55%, which is a live coin flip rather than a base case. The FOMC minutes showed most participants worried about inflation, and consumer inflation expectations at 3.7% give the hawks real ammunition. A sustained crude price above $75 is the single input most likely to turn that probability into a decision.
Why did Bitcoin fall less than oil during the Iran conflict?
Because the conflict threatens tanker traffic through the Strait of Hormuz, and roughly a fifth of seaborne oil moves through it. Bitcoin has no supply exposure to that chokepoint, so it traded as a generic risk asset instead of a war-premium asset. BTC lost about 2.5% while crude added a double-digit premium.
Is Ethereum riskier than Bitcoin during a geopolitical shock?
Historically yes, and the pattern has repeated through every flare-up of this conflict. ETH has fallen two to three times harder than BTC each time, which is the normal high-beta behavior of the second-largest asset in a risk-off tape. Traders who want geopolitical exposure with less drawdown generally hold the BTC side of the pair.
The Bottom Line
The oil spike is real, the war premium is real, and Bitcoin still trades on the Fed. The $77 Brent print does not hurt BTC because of Iran. It hurts BTC if it shows up in the CPI number, because that is what converts a hopeful rate-cut path into a 55% chance of a hike.
Hold $62,000 through the print and the July 8 flush stays what it looks like today, a geopolitical head-fake in a range that runs to $65,500. Reclaim $65,500 with crude fading back under $75 and the cut narrative is alive again. Lose $62,000 on a daily close with Brent still above $77 and you are no longer trading a war headline, you are trading a tightening cycle that the market has not finished pricing. Watch the barrel, then watch the print, then watch the level.
This article is for informational purposes only and does not constitute financial or investment advice. Cryptocurrency trading involves substantial risk. Always conduct your own research before making trading decisions.