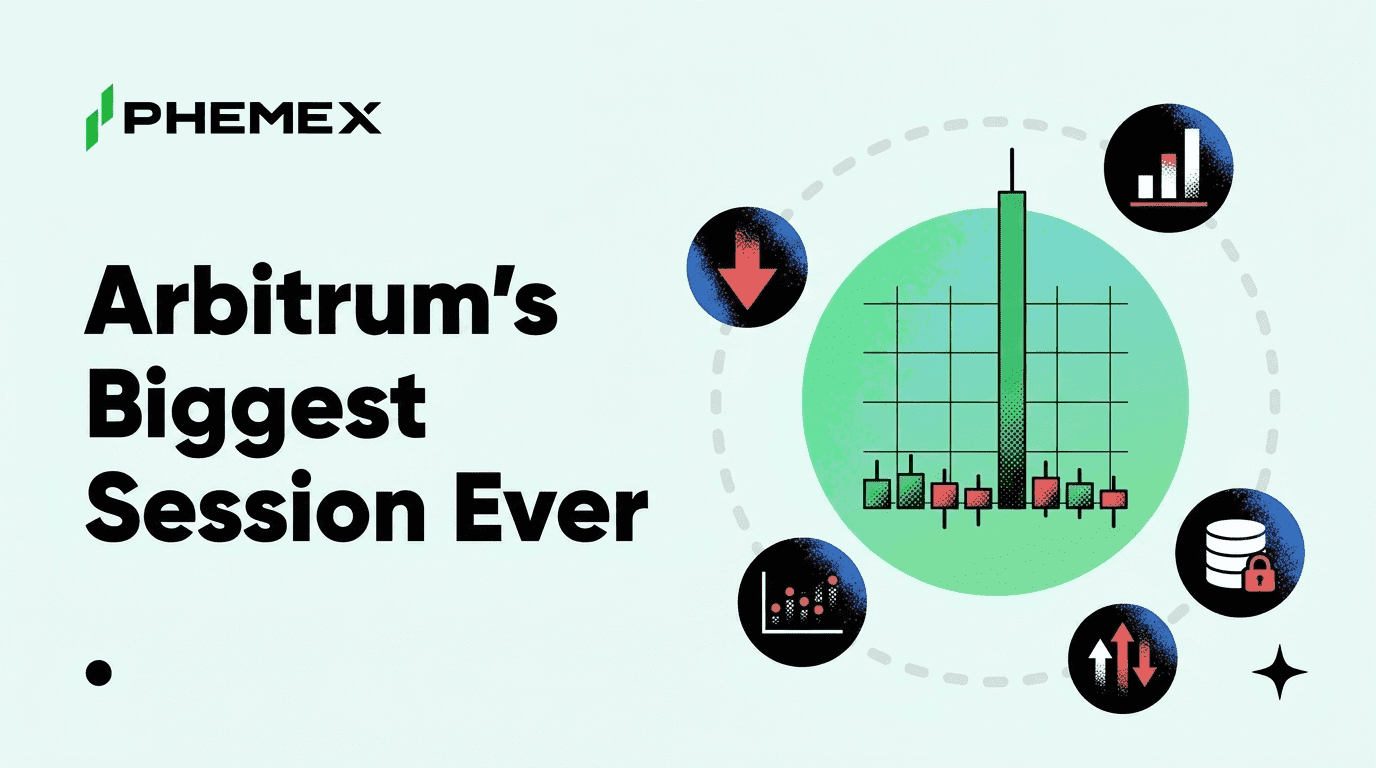
Arbitrum closed Monday 31 August 2026 at 0.1094 after a single-session gain of 29.62%, the largest one-day advance in the token's entire trading record. That record runs 1,259 sessions back to Thursday 23 March 2023, and the previous best was Saturday 10 May 2025 at 27.71%. A second price feed puts the same session at 29.51%, a spread of 0.11 percentage points, so the size of the move holds up across sources. Measured from Monday 24 August, the seven-session gain is a far more modest 12.90%, which is the first clue that one enormous day is doing all of the work.
The move has a named cause with a date attached and a mechanical amplifier running alongside it, and separating the two is what decides how far this can realistically travel.
What Paid For the Monday 31 August Session
Robinhood Chain, a network built on Arbitrum's Orbit framework, produced $1.07 million in 24-hour chain fees on Monday 31 August 2026 against Ethereum's $95,856 over the same window. A chain built on someone else's technology stack out-earning Ethereum itself is the kind of number that moves a token, but the number alone is not why ARB moved.
The reason is a revenue-sharing arrangement. Under the Arbitrum Expansion Program, Arbitrum takes 10% of the fees generated on every Orbit chain, with eight percentage points routed to the DAO treasury and two to the Arbitrum Developer Guild. Offchain Labs co-founder Steven Goldfeder disclosed that split on Thursday 9 July 2026, and the Arbitrum governance documentation on launching new chains describes the self-service path a project uses to deploy under the program.
Read the structure of that arrangement carefully, because the structure is the thesis. The 10% is a royalty on gross chain fees rather than a share of anybody's profit, so it does not depend on an Orbit chain operator running a viable business, only on that chain processing transactions. It also applies to every chain deployed under the program rather than to one flagship deployment, which means the size of the claim scales with how many chains launch and how heavily they get used.
That distinction is the whole difference between a headline and a valuation input. One chain having one enormous fee day is a data point that can reverse the following session. A royalty on a widening set of chains is closer to an annuity, and an annuity is something a market can capitalise. Arbitrum spent its first years monetising blockspace on the chain it operates, and the Expansion Program turns it into a business that takes a cut of blockspace sold by everybody building with its stack. Monday 31 August was the first session where that shift produced a number large enough for the market to notice.
On that Monday window, the Arbitrum Foundation booked roughly $85,654 of revenue on $107,068 of fees. The two figures are internally consistent, because $107,068 is almost exactly 10% of the chain's fee total and $85,654 is 80% of that cut, which is the eight-point treasury share. They still deserve more caution than anything else in this article, since they come from a single onchain data provider rather than a published accounting statement, and single-source revenue figures get revised.
The market has already tried to express this trade through the tokens built around Robinhood Chain, which is a very different bet from owning the asset that collects the fee at the settlement layer.
Why the Control Run Matters More Than the Headline
Any large single-asset move has at least three candidate explanations before you look at a single headline. The whole crypto market moved, the asset's sector moved, or something happened to that one asset. Most coverage skips straight to the third and attaches whatever news broke nearest in time, which is how a token that rallied on liquidity ends up with a story about fundamentals written over the top of it.
The way to avoid that is a control. Take the same window, close to close, and look at what comparable assets did.
|
Asset
|
Monday 31 August session
|
Claim on Orbit chain fees
|
|
ARB
|
+29.62%
|
Yes, 10% of every Orbit chain
|
|
OP
|
+8.50%
|
No
|
|
STRK
|
+5.23%
|
No
|
|
MNT
|
−0.07%
|
No
|
|
BTC
|
+1.14%
|
No
|
Three Ethereum Layer 2 tokens with no claim on Orbit fees moved 8.50% or less, and Bitcoin moved 1.14% while ARB moved roughly twenty-six times that.
The strongest row in that table is the one that did nothing. MNT closing at −0.07% on a session when the Layer 2 sector was supposedly rallying is the cleanest available evidence that there was no sector rally to participate in. OP rising 8.50% is a respectable day in isolation and looks like noise beside the ARB figure. Neither reading survives if you assume everything went up together, and that assumption is exactly what a control is designed to kill.
Be precise about what this does and does not establish. It rules out market beta and it rules out sector beta, which are the two explanations that would make the move meaningless for a forecast. It does not prove the Robinhood Chain fee print caused the move. A control eliminates alternatives, it does not confirm the survivor, and the derivatives data below shows a second mechanism running at the same time.
Two more caveats belong on the table rather than under it. Five assets is a small control, and the three Layer 2 comparables differ from ARB in float, in listing depth and in how much derivative liquidity sits behind them, so identical news would not have produced identical moves anyway. What the control gives you is a floor on the argument rather than a proof of it. Something specific to Arbitrum happened, and the burden sits with anyone claiming otherwise.
The Other Half of the Move Was Mechanical
ARB futures volume reached $814.13 million on that session, an increase of 713.64%, while open interest rose 62.09% to $157.06 million against a backdrop of heavy short liquidations. Two things are true at the same time here, and a forecast that picks only one of them is wrong by construction. A fee-capture story gave traders a reason to buy, and a crowded short book turned that reason into a violent repricing that no amount of spot demand would have produced on its own.
A short squeeze is not a trend. It is a one-time transfer from the traders positioned the wrong way, and once that positioning has been cleared out the same flow of buying stops producing the same candle. The reason most traders get trapped at this point is that they read the size of the move as the size of the conviction behind it.
The useful question is not which cause was bigger, it is which one decays faster, and the two decay on completely different clocks.
The squeeze is a stock and it depletes. A short book is a finite quantity of forced buying. Every liquidation that fires removes fuel from the mechanism that fired it, which is why squeezes resolve in days rather than months and why the second squeeze in the same asset is almost always smaller than the first. Once the shorts that were going to be stopped out have been stopped out, that source of demand is gone and it does not regenerate on its own.
The fee royalty is a flow and it renews. Orbit chains either keep processing transactions or they do not, and the 10% claim reprices every day the chains stay busy. A flow can shrink, and a single record day is a poor guide to a run rate, but it does not deplete simply by being consumed.
That gives you a test rather than an opinion. Watch the second and third Orbit fee prints against the first, because a flow that holds anywhere near the record is a different asset from a flow that collapses back to a rounding error. Then watch open interest against price. If open interest falls back while price holds most of the gain, the leveraged money left and something slower stayed behind, which is the constructive outcome. If open interest holds while price gives the move back, the crowd that was short into Monday has been replaced by a crowd that is long into the retrace, and the same mechanism runs in reverse.
Open interest climbing 62.09% alongside a session gain of that size does say new money arrived rather than old shorts merely covering, which is the more constructive of the two readings available. It also means the crowd has simply moved to the other side of the book.
What the Moving Averages Refuse to Confirm
At the Monday 31 August close, ARB's 50-day simple moving average sat at 0.084914 and its 200-day at 0.098023, leaving the shorter average 13.37% below the longer one. That is a death cross configuration and it has not resolved, so everything described above is a bounce inside a downtrend rather than a change of trend, and how a golden cross and a death cross actually work is the difference between trading this bounce and buying a reversal that has not happened.
Doing the arithmetic on what closing that gap would require is worth the two minutes, because the answer is more demanding than most people assume. The 50-day average has to gain 0.013109 in absolute terms, which is a rise of 15.44% in the average itself. A moving average cannot jump. It moves only as fast as new closes replace the closes rolling out of the back of its window, and each session can shift it by at most one fiftieth of the difference between the arriving close and the departing one.
Put a number on that. If ARB were simply to hold the Monday close of 0.1094 flat every session, and the closes rolling out of the window sat near the 50-day average itself, each session would lift that average by roughly 0.00049. Reaching the 200-day at that rate takes about 27 sessions, which is close to four weeks of holding a record price without giving any of it back. The estimate is deliberately generous. If the departing closes are higher than the average, the same climb takes longer, and any pullback resets the clock rather than pausing it.
So the cross is not a near-term event under any realistic path. It is a multi-week condition that requires the record close to become the new floor, and a trader waiting for confirmation should be planning in weeks rather than sessions.
The dated structure around that is unflattering in every direction except one.
|
Reference
|
Level
|
Date set
|
Monday 31 August close versus it
|
|
All-time closing low
|
0.07272
|
Saturday 15 August 2026
|
+50.4%
|
|
200-day moving average
|
0.098023
|
Monday 31 August 2026
|
+11.6%
|
|
52-week high
|
0.54752
|
Friday 12 September 2025
|
−80.0%
|
|
All-time closing high
|
2.26502
|
Thursday 11 January 2024
|
−95.2%
|
Read the first row and the last row together. ARB printed the lowest close in its history on Saturday 15 August 2026 and the largest gain in its history sixteen days later, both inside the same calendar month. A token doing that is not in a stable regime, and the tidy trend-following forecasts that work on stable regimes do not apply to it.
The Priority Gas Auctions Vote Is the Catalyst Nobody Has Priced
ArbOS 61, named Elara, activated on Arbitrum One and Nova on Thursday 20 August 2026 at 17:00 UTC. Among its changes it added protocol-level priority-fee support, which is the plumbing that a much larger revenue change depends on.
That change is a Constitutional AIP titled Transition Arbitrum One ordering policy to Priority Gas Auctions. It would retire the existing Timeboost express-lane auction and order transactions by priority fee bid instead, routing 97% of the collected priority fees to the ArbitrumDAO treasury and 3% to the Developer Guild, according to the proposal text. The same document puts Timeboost revenue at roughly $2 million annualized against about $7.46 million when it launched, and reversing that decline is the entire argument for the change.
Do not conflate this with the Orbit royalty, because they are separate pools of money with separate splits. The Expansion Program cut applies to fees generated on other people's chains. The Priority Gas Auctions split applies to priority fees generated on Arbitrum One itself, the chain the DAO already operates. Both point at the same underlying re-rating, in which ARB stops being valued on activity it hosts for free and starts being valued on revenue the protocol actually collects, but they arrive through different doors and a forecast that adds them together without saying so is double counting.
Check the stage before trading it, because the stage has moved further than most coverage suggests. The proposal cleared its Snapshot temperature check, was consolidated with a companion Fast Feed AIP, and went to a single on-chain Constitutional vote that opened on Thursday 20 August 2026. A confirmed final on-chain result was not available at the Monday 31 August close, so treat sequencer revenue reform as proposed rather than delivered, and treat any forecast that already prices it in as premature.
What makes this the most interesting item on the calendar is that the outcome is binary and the effect is measurable. A passed vote converts a declining revenue line into a rising one on a chain that already carries traffic, and the collected priority fees would then be visible onchain rather than inferred from a data provider. A failed vote leaves Timeboost in place at roughly a quarter of its launch run rate.
Supply Is the Constraint Nobody Is Pricing
Circulating supply is where two-feed discipline earns its keep. One source puts ARB's circulating supply at 6.678 billion against the 10 billion cap and another at 6.151 billion, a spread of roughly 8%, which is far too wide to quote a single number from. Take the range instead. Somewhere between 61.5% and 66.8% of ARB is circulating, which leaves close to a third of the supply still locked.
A further vesting tranche is scheduled. Two sources give conflicting dates for it and neither is confirmed, so no date appears here, and any reader who sees a confident September 2026 unlock date for ARB should check it against the vesting contract before positioning around it.
The direction is not in dispute even when the dates are. Fee capture adds a claim on a treasury while token inflationadds supply to the float, and a forecast that counts the first without the second is doing half the arithmetic and calling it a thesis. Revenue growing at the same pace as the float leaves per-token value flat, which is the scenario nobody writes about because it makes for a boring headline and an accurate one.
Frequently Asked Questions
Is there a US spot Arbitrum ETF?
No, and the difference matters to anyone modelling a demand catalyst. The only listed ARB vehicle is a European exchange-traded product, 21Shares AARB in Amsterdam, and no US spot ARB fund exists. Anyone building a US approval into an ARB forecast is pricing a product that has not been created.
What is an Arbitrum Orbit chain?
Orbit is the framework third parties use to launch their own Layer 2 or Layer 3 network on Arbitrum's technology stack instead of sharing blockspace on Arbitrum One. Robinhood Chain is one such deployment. The commercial point for ARB holders is that Orbit chains run under the Expansion Program, which is what gives the DAO a claim on their fees at all.
Do Robinhood Chain fees get paid to ARB holders?
Not directly. The eight-point treasury share lands in the ArbitrumDAO treasury, and that treasury spends by governance vote rather than distributing to wallets. Fee capture is a claim on a balance sheet the token controls, which is real but slower and much less certain than a dividend.
What would confirm that the ARB downtrend is over?
The 50-day average crossing back above the 200-day, which from a gap of this size needs sustained higher closes across weeks rather than one session. A daily close above the 200-day average is the first checkpoint, and a run of closes holding above it is the second.
Can ARB reach $1 again?
Reaching $1 would take considerably more than the Orbit fee story delivers. At the 10 billion token cap, $1 implies a $10 billion fully diluted valuation, and annualizing the single best fee day on record produces about $31 million, which is roughly 0.3% of that valuation. ARB has traded far higher historically, so the level is not impossible, but nothing in the verified data points at it.
Bottom Line
The forecast question for ARB is not how large the Monday 31 August session was, it is how much of that gain survives the short book being cleared out. The fee-capture mechanism is real, dated and asset-specific, and the control across OP, STRK, MNT and BTC removes the sector explanation entirely. The structure is still bearish, so until the 50-day average closes its 13.37% gap to the 200-day across the four weeks or more that would take, the level that decides everything is 0.098023, and a failure to hold above it puts the Saturday 15 August closing low of 0.07272 back on the table. Watch the on-chain outcome of the Priority Gas Auctions vote and the next run of Orbit fee prints. A fee story that prints once is a headline, and a fee story that prints every week is a revaluation.
This article is for informational purposes only and does not constitute financial or investment advice. Cryptocurrency trading involves substantial risk. Always conduct your own research before making trading decisions.