









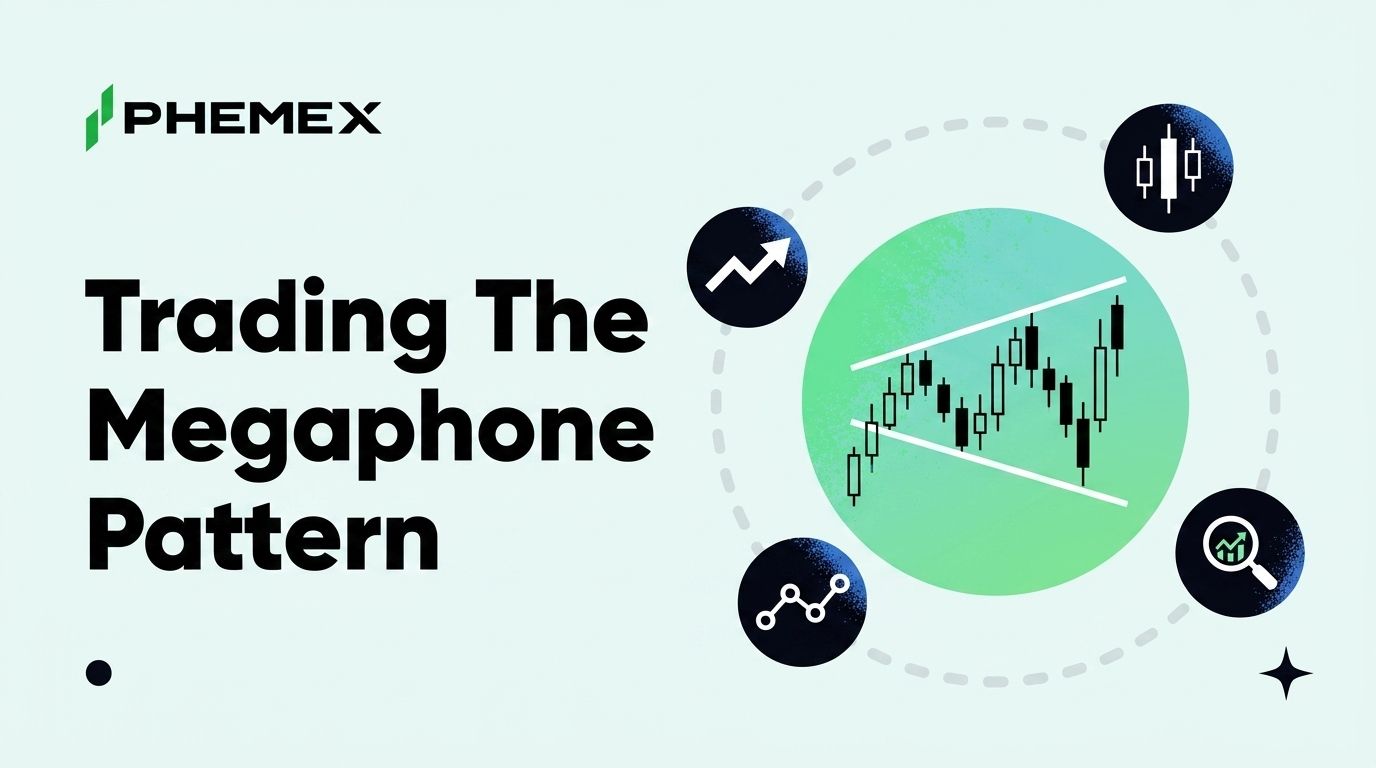
Most chart patterns squeeze price into a narrower range until something gives. The megaphone pattern is a chart formation that prints higher highs and lower lows at the same time, expanding the trading range with every swing instead of compressing it. Also called a broadening formation or broadening wedge, it is drawn with two diverging trendlines and shows up most often at market tops and in choppy, high-volatility stretches.
That structure makes it one of the most hostile environments in trading. Longs get stopped below the last low, shorts get squeezed above the last high, and each reversal travels farther than the one before it.
The pattern punishes anyone who treats it like a normal setup, because its defining feature, widening swings, forces stops to widen along with it. Getting paid here starts with sizing for that width before picking a direction.
How to Identify a Megaphone Pattern
A valid megaphone needs two things. The first is a pair of diverging trendlines, an upper line connecting a series of rising swing highs and a lower line connecting a series of falling swing lows. The second is a minimum of five swing points, usually three touches on one line and two on the other, before the structure counts as confirmed. Two touches per line can be coincidence, but five alternating touches mean both sides of the market are pressing harder with each wave.
What the pattern signals is indecision with rising aggression. Buyers chase every new high, sellers hammer every new low, both groups get paid briefly and then punished, and nobody establishes control. Investopedia's broadening formation entry files it under increasing disagreement among investors, which is why it appears so often after long uptrends, when conviction splinters right where it used to be strongest.
Volume behaves differently here than in most consolidation patterns. Contracting structures like flags and triangles see volume dry up as the range narrows, while a broadening formation usually keeps volume elevated and irregular, often rising into each new extreme as another wave of traders commits at the worst possible price. Reading those individual swings takes candle-level skill, and our candlestick patterns guide covers the building blocks this pattern is made of.
Ascending vs Descending Broadening Wedges
The textbook megaphone is roughly symmetrical, with the upper line rising and the lower line falling at similar angles. Two tilted variants matter just as much in practice, and they lean in opposite directions. The table below compares them.
|
Feature
|
Ascending broadening wedge
|
Descending broadening wedge
|
|
Trendline slopes
|
Both point up, diverging
|
Both point down, diverging
|
|
What price is doing
|
Highs accelerate while lows rise slowly
|
Lows collapse faster than highs decline
|
|
Crowd psychology
|
Buying climax, late longs chase every push
|
Panic selling, capitulation deepens each leg
|
|
Typical resolution
|
Bearish, breakdown through the lower line
|
Bullish, recovery through the upper line
|
|
Common location
|
Late in extended uptrends
|
Late in extended downtrends
|
|
Trade trigger
|
Candle close below the lower line
|
Candle close above the upper line
|
The word "typical" carries real weight in that table. The tilted variants lean directional, but nothing obligates them to resolve that way, and the trigger column matters more than the resolution column. An ascending broadening wedge at the top of a long rally often forms in the same zone where a double top would print, and both structures are telling you demand is being tested rather than trending.
Two Ways to Trade a Megaphone
Only two entry types make sense inside this pattern, and everything else is donating money to faster traders.
Fade the edges. Wait for price to tag the upper trendline, demand a confirmed rejection such as the setups in our guide to reversal candles, and short back toward the middle of the range with a stop just beyond the trendline. At the lower line, mirror the trade on the long side. This works because the pattern, by definition, rejects its edges until the day it stops, so take partial profit at the midline instead of holding for the far side. The stop placement is non-negotiable, since a position without a hard invalidation point inside an expanding range is how accounts disappear.
Trade the breakout. Wait for a full candle close beyond one of the trendlines on rising volume, then enter on the break itself or on the retest of the broken line, which offers a tighter stop. Measured-move targets are less dependable here than in contracting patterns because the megaphone has no fixed width, so a practical compromise is projecting the height of the final swing from the breakout point. Trade the break you actually get, not the one you predicted.
Respect the middle. In the middle third of the range, your stop has to sit beyond a trendline that keeps moving farther away while your target sits nearby. The risk-reward is upside down, which makes the center of a megaphone a no-trade zone regardless of how strong the move through it looks.
Where the Pattern Fails
The megaphone's geometry creates its own failure modes, and they cluster at the edges.
Fakeouts through a widening edge. Because the trendlines diverge, each successive touch happens farther from the pattern's origin, and a push through the line that would count as decisive in a triangle can simply be the next, wider swing here. Requiring a full candle close beyond the line filters most of these, and requiring a retest that holds filters even more, at the cost of missing the fastest resolutions.
Low-liquidity wicks. Crypto trades around the clock, and thin weekend or overnight order books routinely print spikes through a trendline that reverse within minutes. Those spikes stop out edge-faders and trap breakout traders simultaneously, and they are the single biggest reason megaphone trades fail on lower timeframes. Our breakdown of long-wick candles covers why those moves happen and how to tell a liquidity grab from a genuine break.
The wide-stop problem. No other failure mode defines this pattern the way stop distance does. A proper stop beyond a diverging trendline is simply farther away than a stop in a flag or a triangle, and the fix is arithmetic rather than courage. Decide your account risk per trade first, say 1%, then divide it by the stop distance to get position size. If the fade at the upper edge needs a 4% stop where your usual setup needs 2%, you trade half your usual size, and late in the pattern, when the range is widest, you trade smaller still. The pattern's swings grow, so your size has to shrink.
Megaphone vs Symmetrical Triangle
The two patterns are near-perfect mirrors, and confusing them leads to using the wrong playbook. A symmetrical triangle's trendlines converge, volume fades as the coil tightens, and the measured move from its widest point gives a reliable target. A megaphone's trendlines diverge, volume stays heavy and erratic, and targets are estimates at best.
The psychology is mirrored too. A triangle is a market narrowing toward agreement, while a megaphone is a market losing it. That difference changes the trade. Triangles reward patience and breakout entries, megaphones reward fading extremes and punish anyone who buys strength or sells weakness late in a swing. Our guide to Bitcoin triangle patternscovers the converging side of that mirror in detail.
What Bitcoin's Widening Range Shows Right Now
Bitcoin's recent weekly action is a live illustration of expanding swings. Support at $63,000 held through mid-July, price pushed to a one-month high of $65,700 on Monday, July 20, then pulled back under $64,000 in the same session, a round trip of more than $1,700 in a single day, and BTC now trades near $65,410. The highs are getting higher while intraday travel keeps stretching, which is exactly the raw material broadening structures are built from.
To be clear, this is an emerging illustration, and it does not meet the five-swing-point standard for a confirmed textbook megaphone. Drawing diverging trendlines on a handful of sessions and calling the pattern complete would be overclaiming, and overclaiming is how traders end up positioned for a structure that never existed.
What a disciplined trader does with it is simpler. Mark $63,000 as the level that keeps the current range alive and $65,700 as the swing high to beat, and if the swings keep alternating and widening from here, apply the megaphone playbook. That means smaller size, confirmed rejections at the edges, and no positions in the middle.
Frequently Asked Questions
Is a megaphone pattern bullish or bearish?
Neither by default. The megaphone signals expanding volatility and deep disagreement between buyers and sellers, and direction comes from context and confirmation. An ascending broadening wedge late in an uptrend leans bearish, a descending one after a long decline leans bullish, and the symmetrical version gives a directional signal only when a candle closes decisively beyond one of its trendlines.
How do you trade a broadening wedge?
The two workable approaches are fading the edges and trading the breakout. Faders short confirmed rejections at the upper trendline and buy confirmed bounces at the lower one, with stops just beyond the line they are leaning on, while breakout traders wait for a full candle close outside the pattern on rising volume. Both camps cut position size to compensate for the wider stops the structure forces.
What is the success rate of the megaphone pattern?
The honest answer is that no reliable published success rate exists. Studies define the pattern inconsistently, samples are small, and because the trendlines diverge there is no agreed standard for what counts as a completed target, so any precise percentage you see quoted is marketing rather than measurement. Treat the megaphone as a volatility framework and let risk management, rather than a statistic, carry the trade.
What timeframe is best for trading the megaphone pattern?
The 4-hour and daily charts produce the cleanest structures, because each swing point represents enough participants to make the trendlines meaningful. On 5-minute and 15-minute crypto charts the shape appears constantly but is mostly noise, and thin-liquidity wicks pierce the lines often enough to make edge-fading unreliable there. The bigger the timeframe, the more each touch is worth trusting.
Bottom Line
The megaphone is a volatility pattern first and a directional pattern second, and the rules for engaging it are mechanical. If a chart shows five alternating touches on diverging trendlines, cut your normal position size before planning any entry. If price tags an edge and prints a confirmed reversal candle, fade it toward the midline with a stop just beyond the trendline. If price is drifting through the middle of the range, there is no trade, and if a candle closes beyond either line on strong volume, switch from fading to breakout mode and let the market pick the direction. Traders who blow up in broadening markets almost never misread the pattern. They sized it like a quiet one.
This article is for informational purposes only and does not constitute financial or investment advice. Cryptocurrency trading involves substantial risk. Always conduct your own research before making trading decisions.
