
Most of the crypto market is trading inside a descending channel right now, with Bitcoin near $60,714 after a multi-week selloff that dragged nearly every major coin into a steady sequence of lower highs and lower lows. The pattern looks ugly because it is built out of selling, but it is also one of the cleanest setups a trader can work with. A descending channel gives you two parallel lines, a defined range to trade inside, and a single break point that tells you when the trend may be over.
This matters today because breakouts in a weak tape fail more often than they succeed, so drawing the channel correctly and demanding confirmation is the difference between catching a real reversal and getting trapped in a dead-cat bounce. Here is how to draw a descending channel, trade both the breakout and the range inside it, and set entries, stops, and targets without guessing.
What a Descending Channel Is and How to Draw It
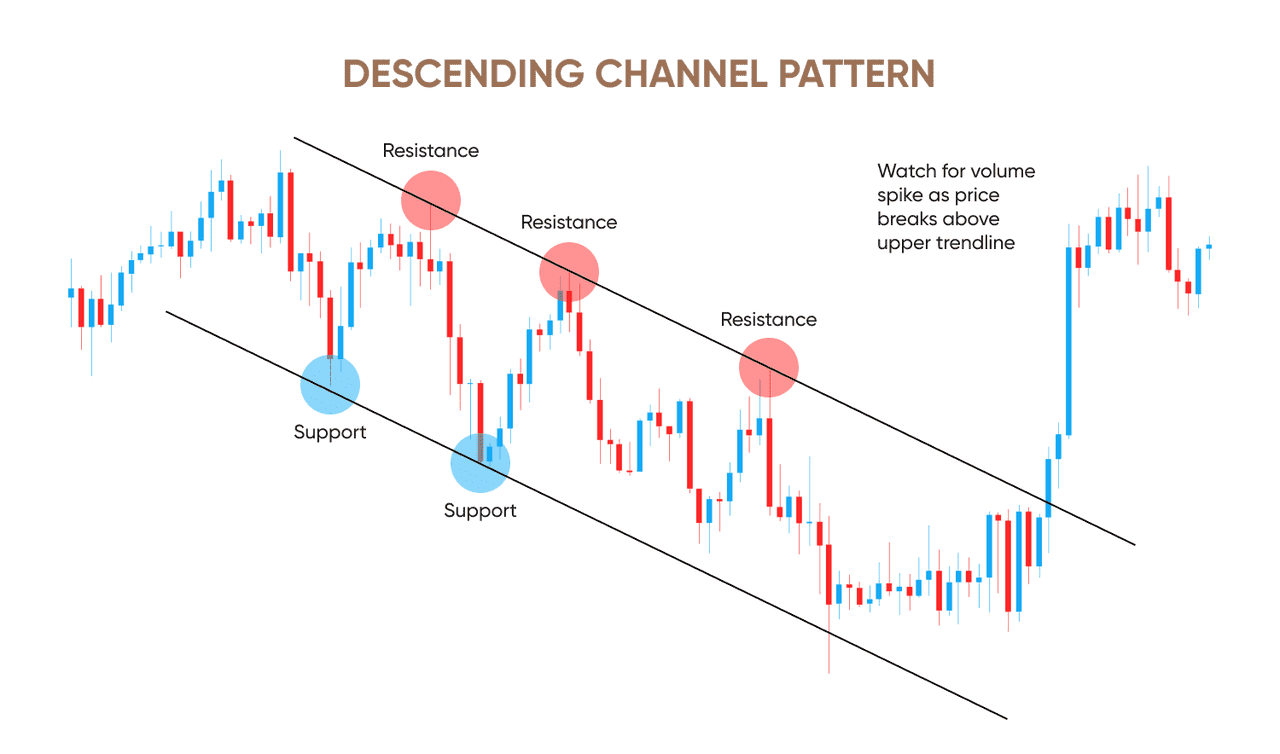
A descending channel forms when price makes a series of lower highs and lower lows that fit between two parallel, down-sloping trendlines. The upper line connects the lower highs and acts as resistance, while the lower line runs parallel beneath it, connecting the lower lows and acting as support. When both lines slope down at roughly the same angle and price keeps bouncing between them, you have a valid channel.
Source: Capital.com
Drawing it is simpler than most traders make it. Start with the upper trendline, because resistance caps every bounce and it is usually the cleaner line. Connect at least two swing highs, then look for a third touch to confirm the angle is real. Draw a parallel copy and slide it down until it sits under the obvious swing lows. The more times price respects a line without closing through it, the more traders are watching that exact level.
A few rules keep the channel honest. The two lines should be close to parallel, not converging, because a converging shape is a falling wedge that behaves differently. Wicks can pierce a line briefly, but you care about candle closes, not shadows. If price keeps closing well outside your lines, the channel is drawn wrong and needs fresh swing points. The same trendline discipline governs both single candles and multi-week structures, which is why a grounding in candlestick patterns makes channel reading easier.
Continuation Channel Versus Reversal Breakout
Not every descending channel means the same thing, and this is where most traders misread the pattern. The context around the channel decides what a break is likely to do.
A continuation channel appears inside an existing downtrend and acts as an orderly pause before more selling. Price grinds lower in a controlled, parallel range while sellers stay in charge, and the resolution tends to be a break of the lower line that extends the downtrend. In this version the channel is just the trend taking a breath.
A reversal channel is the more profitable read. After an extended decline, a descending channel can mark the zone where sellers are exhausting themselves and buyers are quietly accumulating into every dip. The tell is a break of the upper line on rising volume, often after the lows inside the channel start getting shallower. This is the bullish breakout traders hunt for, because it can flip a downtrend into a new uptrend. The shape can also resemble a falling bull flagwhen it appears as a short pullback inside a larger uptrend, and that distinction changes your bias before you take the trade.
The honest answer is that you cannot know in advance which one you have. That is exactly why the breakout itself, with volume behind it, is the signal you wait for rather than front-running the move.
How to Trade the Breakout With Entries, Stops, and Targets
A descending channel breakout is a long setup that triggers above the upper line, but only with confirmation. In a falling market the upper line gets tagged and rejected over and over, so jumping in on the first touch is how traders get chopped up. The break has to prove itself, and here is the checklist for a confirmed upside breakout:
- Candle close above the upper line, never a wick that pokes through and falls back inside.
- Volume expansion on the breakout candle, well above the average of the prior channel candles. A breakout on shrinking volume is the most common trap.
- A retest that holds. Price often returns to the broken upper line, which now acts as support. A clean bounce off that retest is the lower-risk entry.
- Broader market confirmation. In a weak tape, one coin breaking out while everything else bleeds is suspect.
You have two entries. The aggressive one is on the breakout candle close above resistance. The conservative one waits for the retest of the broken line to hold, which gives a tighter stop. The stop loss sits back inside the channel, below the breakout candle or the most recent swing low, because a close back inside the lines means the breakout failed.
Targets come from the measured move, the standard projection for channels. Measure the vertical height of the channel from the lower line to the upper line at its widest point, then project that distance up from the breakout point. A descending channel that is $4,000 tall projects roughly a $4,000 move above the break, and you can scale out into that level rather than holding for a perfect top. This is the same logic that powers projections on triangle patterns and other measured structures.
Range-Trading the Channel Itself
You do not have to wait for the breakout to trade a descending channel. As long as price respects both lines, the channel is a range, and ranges can be traded in both directions.
The conservative side is the short. Inside a confirmed downtrend, selling near the upper line with a stop just above it and a target near the lower line trades with the prevailing direction, which is why it carries the higher probability. Each touch of resistance that fails to break is another short in the direction of the trend.
The counter-trend side is the long off the lower line, buying support with a tight stop below it and a target back up at resistance. This is the lower-probability trade because you are fighting the downtrend, so it demands smaller size and a faster hand. Most traders lose money here by treating the counter-trend long as if it were as safe as the trend-following short. It is not. A break of the lower line stops you out fast, and in a bear market that break comes more often than the textbook suggests. A confirmation candle like a reversal candle at the line, rather than a bare touch, improves the odds on either side.
The Common Traps That Burn Traders
The descending channel has a few failure modes that show up again and again, and a falling market makes all of them worse.
The biggest is the false breakout, where price closes above the upper line, pulls in breakout buyers, then collapses straight back inside the channel and resumes the downtrend. This is why volume confirmation and a willingness to wait for the retest are not optional in a weak market. A breakout that cannot hold its own break level on a retest is telling you the buyers were not real.
Trap | What it looks like | How to avoid it |
False breakout | Close above the line, then snap back inside | Demand volume expansion plus a holding retest |
Bear-market context | Breakout fails because the macro trend is still down | Confirm with the broader market, not one chart |
Forcing the lines | Cherry-picking touches to draw a channel that is not there | Require two clean touches per line, judge by closes |
Counter-trend overconfidence | Treating the support long like a safe trade | Size down, use a tight stop, respect the trend |
The second trap is context. A picture-perfect breakout still fails if the whole market is in a deeper downtrend and the channel was only a small continuation pause. The third is forcing a channel onto price that is not really channeling, so when in doubt, fewer clean touches beat a busy chart with five forced trendlines. The same caution applies to a double top forming at the upper line, which can cap a breakout before it gets going. The structure reads the same on Bitcoin as it does on a small-cap alt.
Frequently Asked Questions
What is a descending channel?
A descending channel is a chart pattern where price makes lower highs and lower lows inside two parallel, down-sloping trendlines. The upper line acts as resistance and the lower line acts as support, and price tends to bounce between them until it breaks out of one side. The Investopedia channel definition covers the broader family of channel patterns.
Is a descending channel bullish or bearish?
By itself the pattern is bearish, because lower highs and lower lows define a downtrend. The bullish read only arrives when price breaks above the upper line on rising volume, which can flip the structure into a reversal. Until that confirmed break happens, the base case stays bearish.
How do you trade a channel breakout?
You wait for a candle to close above the upper line with above-average volume, then either enter on that close or wait for a retest of the broken line to hold as support. Your stop goes back inside the channel below the breakout candle, and your target is the measured move, which is the channel height projected up from the break. The same playbook is covered in broader technical analysis education on TradingView.
What is the difference between a descending channel and a falling wedge?
A descending channel has two roughly parallel lines, while a falling wedge has two converging lines that narrow as price moves toward the apex. The wedge is a more reliably bullish reversal pattern, whereas a channel can be either continuation or reversal depending on context and the breakout.
Bottom Line
Treat the descending channel as a map, not a prediction. While price stays inside the lines, the higher-probability trade is selling resistance with the trend, and the counter-trend long off support stays small. The setup that pays is the confirmed upside breakout, which means a candle close above the upper line, volume expansion, and ideally a retest that holds. Anything less than that in a market with Bitcoin near $60,714 is a coin flip dressed up as a pattern. Project your target from the channel height, put your stop back inside the lines, and let the break prove itself before you trust it.
This article is for educational purposes only and does not constitute financial or investment advice. Cryptocurrency trading involves substantial risk. Always conduct your own research before making trading decisions.