









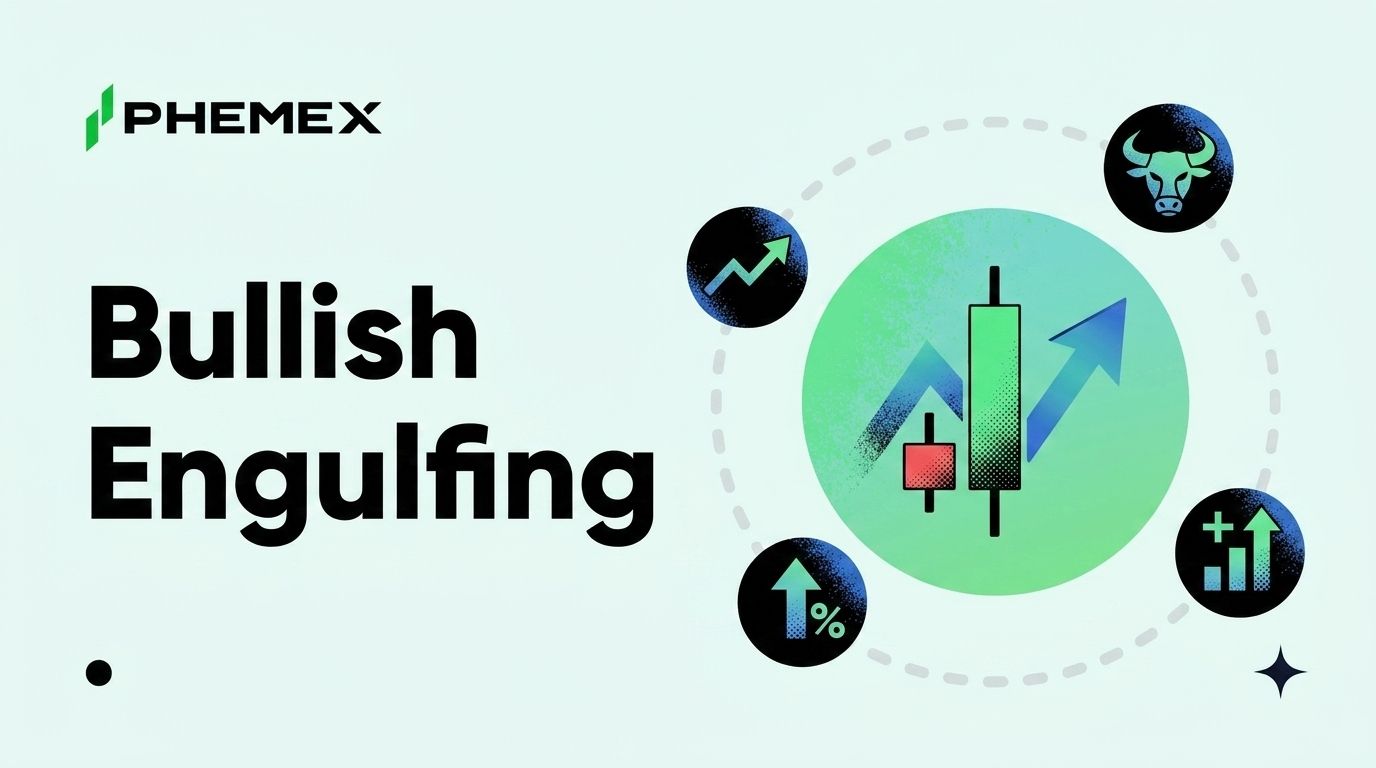
The bullish engulfing candle is the pattern most retail traders point to when they say a bottom is in, and it is also the pattern most retail traders get burned by when they take it without confirmation. It is a two-candle reversal setup where a single large green body fully swallows the previous red body at the end of a downtrend, telling you that buyers overwhelmed sellers in one session. BTC printed a textbook version of this pattern off the $77,000 support zone in late May 2026, and traders who waited for the close before entering caught the bounce while those who entered on the wick alone got faked out.
Here is what the pattern actually is, the four conditions that separate a real signal from noise, and the specific stop and target rules that turn it into a tradeable setup.
What Is a Bullish Engulfing Candle
A bullish engulfing candle is a two-candle Japanese candlestick pattern that signals a potential reversal at the bottom of a downtrend. The first candle is a small red (bearish) body that continues the existing downtrend. The second candle opens at or below the close of the first candle and closes ABOVE the open of the first candle, fully engulfing the prior body with a large green (bullish) range.
Source: TrueData
The pattern matters because it shows a visible shift in who controls the session. Sellers were in charge yesterday, but today buyers pushed price all the way through the prior open with enough force to invalidate yesterday's range entirely. That kind of one-session takeover does not happen in healthy downtrends, it happens at exhaustion points where the supply pushing price down finally runs out.
The pattern is most reliable on the daily and 4-hour charts. On a 5-minute chart you will see dozens of "engulfing" candles per day and almost none of them mean anything. If you are not familiar with the broader candlestick framework, the Phemex academy page on understanding candlestick patterns in crypto walks through the full family of setups that this one belongs to.
Anatomy of the Two-Candle Setup
The pattern has four physical requirements. Miss any of them and what you are looking at is not a bullish engulfing candle, it is something else.
|
Component
|
What it looks like
|
|
Candle 1
|
Small red body. The smaller, the better. Long upper wick is a bonus.
|
|
Candle 2
|
Large green body. Opens at or below candle 1 close. Closes above candle 1 open.
|
|
Engulfment
|
The candle 2 BODY (open to close) must cover the candle 1 BODY. Wicks do not count.
|
|
Context
|
The setup must appear at the END of a clear downtrend, not in a sideways chop.
|
The body-only engulfment rule is the one most traders get wrong. If yesterday's candle had a wide range with a long upper wick and a tiny red body, today's green candle only needs to swallow the red body, not the wick. The stricter body-only definition produces fewer signals but each one carries more weight, which is the trade-off worth taking with real money on the line.
How to Read the Signal in Real Time
Reading the pattern as it forms is different from reading it on a closed daily chart. The candle you are watching is not a bullish engulfing candle until it closes, and a green hourly that looks engulfing at 10:00 PM UTC can still print a red body by midnight if sellers return. Wait for the candle close on whatever timeframe you are trading.
Once the candle closes, ask three questions in order. Was there a clear downtrend before the setup? An engulfing inside a sideways range is statistical noise, because the pattern requires something to reverse FROM. Second, where did the green candle close relative to nearby resistance? A close that pushes back above a key moving average (the 20 EMA or 50 EMA on whatever timeframe you trade) or back above a recent broken support carries far more weight than a close that stops just shy. Third, how does the body size compare to the average daily range of recent candles? A green body two or three times the size of the recent average tells you the move had real conviction.
BTC's late-May 2026 setup off the $77,000 zone passed all three filters. The pattern came after a six-day decline from $84,000 down to the high $76,000s, the engulfing candle closed back above the 20-day moving average at roughly $79,400, and the green body printed roughly 2.5 times the average daily range of the preceding two weeks. Without those filters, the same wick shape would have been a coin flip.
Confirmation Signals That Separate Real From Fake
The pattern by itself is a coin-flip plus a small edge, while the pattern plus confirmation is where the real probability lives. Four confirmation filters do most of the work, and each one removes a chunk of the false-signal population.
RSI below 30 on the same timeframe. When the Relative Strength Index has pushed into oversold territory before the engulfing prints, the pattern is much more likely to mark a real exhaustion bottom. RSI in the 40s or 50s means sellers were never really stretched, which means the pattern is more likely to be a pause than a reversal.
Volume on the green candle. The engulfing session needs to print noticeably higher volume than the recent average. Volume is the receipt that proves real money showed up, rather than thin-liquidity wick-hunting. A bullish engulfing on declining volume is one of the highest false-signal rates in technical analysis. Long-tailed wick rejections often confirm the same exhaustion theme, and the Phemex academy guide to long-wick candle trading covers the related reversal setup.
Close above key resistance. The strongest setups close back above a level that mattered on the way down. That could be a horizontal support that flipped to resistance, a major moving average, a Fibonacci retracement level, or the top of the prior consolidation. A close back above a level the market was respecting confirms that the reversal is real rather than a one-day mean-revert.
Higher low on the next candle. This is the cleanest single confirmation available to a chartist. After the engulfing closes, you want the NEXT candle to print a higher low than the engulfing candle. If the next session takes out the engulfing low, the signal is dead and you exit. This filter alone removes roughly half of all false positives at the cost of entering one candle later than you otherwise would. For a deeper read on the full reversal-candle family, the Phemex academy page on reversal candles and how to read them covers hammers, shooting stars, and morning stars alongside the engulfing pattern.
The Trading Strategy: Entry, Stop, and Target
The mechanics of the trade are simple once the pattern and confirmation are in place. Entry goes on the close of the engulfing candle, or one tick above its high if you want a slightly higher-confidence entry. The stop-loss goes BELOW THE LOW of the engulfing candle, not the prior candle low and not a round number nearby. If price prints below that low, the pattern is invalidated.
Target sizing depends on the body height, which is the range from the low of the engulfing candle to its close. A conservative target is 2x that height projected above the entry, while an aggressive target is 3x and works best when there is no obvious resistance between entry and target. The risk-reward at the 2x target is roughly 2 to 1, which means the strategy only needs to be right roughly 40% of the time to be profitable.
Position sizing should account for stop distance rather than dollar move. If the engulfing candle has a range of $1,500 and your account risk per trade is 1%, size the position so that a $1,500 adverse move equals 1% of the account.
Common Failure Modes
The pattern fails in predictable ways. Knowing the failure modes is more useful than knowing the successes, because most traders only learn the success template and assume every setup will work.
The pattern fails when it appears in a sideways range instead of after a clear downtrend. A green candle engulfing a red candle in chop is meaningless because there is no exhaustion to reverse, only noise getting reshuffled. If you cannot draw a clean downtrend line into the setup, do not trade the pattern. The opposite-direction continuation pattern — the three black crows — is a useful sanity check that the prevailing trend really is bearish before any engulfing reversal becomes meaningful.
The pattern fails on thin volume. A bullish engulfing on holiday-thin or weekend-thin volume often gets unwound on Monday when real flow returns, and the same applies to overnight sessions in low-liquidity altcoins.
The pattern fails without RSI confirmation. An engulfing candle that prints with RSI sitting at 50 means the move that preceded it was a price decline rather than real momentum exhaustion, and without exhaustion there is no statistical edge in the reversal signal.
The pattern also fails when traders enter on the wick before the candle closes. A candle that looks engulfing at the 75% mark can still print red by the close, especially on intraday timeframes where the last 30 minutes routinely reverse the prior five hours. The number of trades skipped by waiting for the close is small, while the number of false entries avoided is large.
Frequently Asked Questions
Does the bullish engulfing pattern work in crypto the same way it works in stocks?
Yes, with two differences. Crypto runs 24/7, so the "session" is more arbitrary than in equities and the timeframe choice matters more. Crypto is also more volatile, which makes body sizes larger and wick noise more frequent. The pattern works on BTC, ETH, and large-cap alts on daily and 4-hour charts.
Can I trade the bullish engulfing pattern on a 5-minute or 15-minute chart?
You can, but the false-signal rate is much higher and the edge is much thinner. Intraday engulfing candles are usually noise within a larger trend. If you trade them, treat the position as a scalp with a tight stop and a quick target.
What is the difference between a bullish engulfing and a bullish harami?
They are opposite patterns. In a bullish engulfing the SECOND candle is large and engulfs the first. In a bullish harami the first candle is large red and the second is a small green body that sits inside the prior body's range. The engulfing is typically the stronger signal.
How often does the pattern actually work?
On the daily timeframe for BTC and ETH, with all four confirmation filters applied, historical hit rates run roughly 55 to 65%. Without confirmation filters the hit rate drops closer to 50%, which means the pattern alone is barely an edge.
Bottom Line
The bullish engulfing candle is a two-candle exhaustion signal, not a one-candle prediction. It earns its edge only when it appears after a clear downtrend, prints on above-average volume, lines up with oversold RSI, and closes back above a level the market was respecting on the way down. Entry on the candle close, stop below the engulfing low, target two to three times the body height. The traders who lose money on this pattern almost always lose it for one of three reasons: they entered before the candle closed, they took the signal in sideways chop, or they sized the position by dollar amount instead of by stop distance. Get those three right and the pattern stops being a screenshot and starts being a tradeable setup.
This article is for educational purposes only and does not constitute financial or investment advice. Cryptocurrency trading involves substantial risk. Always conduct your own research before making trading decisions.
