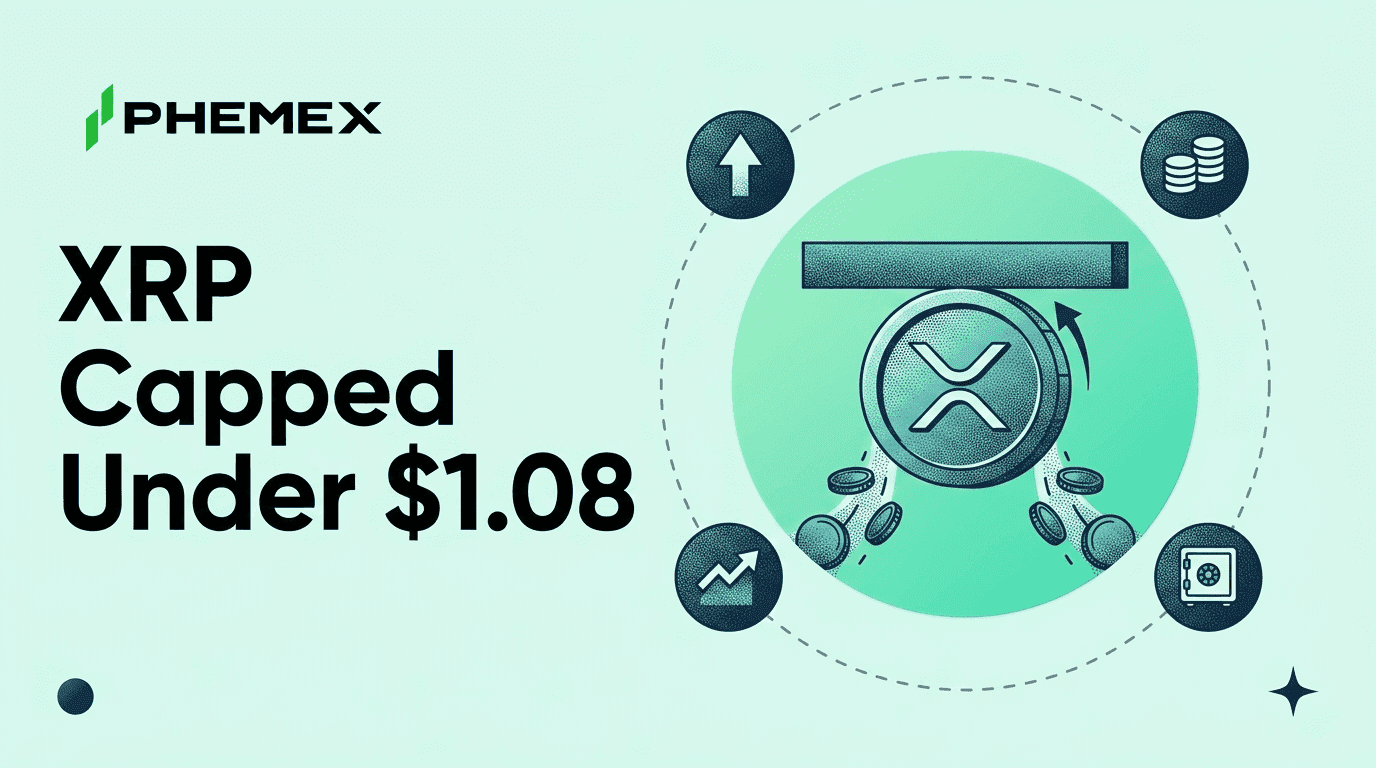
XRP is trading at $1.079 as of 04:21 UTC on Sunday, August 2, 2026, up 1.3% in 24 hours per CoinGecko and still pinned below $1.08 for a fifth consecutive session. XRP is the native token of the XRP Ledger, a blockchain built for fast, low-cost payments and settlement, and it has spent the entire week pressing against the same ceiling. Every rejection produced the same response from one corner of the market. The ETF desks kept buying.
|
Metric
|
Reading
|
|
XRP price
|
$1.079 (CoinGecko pull, 04:21 UTC, August 2, 2026)
|
|
24-hour change
|
+1.3%
|
|
Sessions capped under $1.08
|
Five
|
|
XRP ETF flow, Friday July 31
|
+$7.69M
|
|
XRP ETF net inflow, July
|
+$27.29M
|
|
Bitcoin dominance
|
56.36% (04:23 UTC, August 2)
|
That gap is the whole story this weekend. The chart shows five failed attempts to reclaim a level XRP traded above for most of July. The flow data shows $7.69 million of fresh XRP ETF money on Friday, July 31, closing a month in which the products absorbed $27.29 million. Retail sees a coin that cannot break out. Institutions see a discount that keeps refilling, and one of those two readings gets proven wrong within days.
Five Sessions at the Same Ceiling
The week unfolded as one long rejection. Monday's session held support and kept the recovery case alive, which is where our Monday XRP coverage left it. Tuesday brought the first clean run at the ceiling, and it failed, producing the level map we published that day with $1.00 and $0.975 marked as the downside checkpoints. Wednesday's bounce had dead-cat written all over it, fading before price ever reached the line. Thursday sellers defended the ceiling again, and the weekend has settled into a quiet drift beneath it, with Sunday's tape at $1.079 close enough to touch the barrier without testing it.
This zone has history. Our July analysis of the $1.09 level mapped the same shelf three weeks ago, and the market has returned to it from both directions since. A level fought over this many times rarely resolves quietly. Supply from buyers trapped at higher prices sits stacked between $1.08 and $1.10, and each rally attempt has to eat through those resting sell orders before it can extend. Five attempts in five days means the shelf is thinning, but it also means the sellers have not run out yet.
The mechanics matter for what comes next. Think of resistance as a wall built from limit sell orders, where every test knocks out bricks that only get replaced if new sellers show up at the same price. Repeated tests tend to weaken a level for exactly that reason, and five tests in five days is the case for treating this week's failures as compression rather than exhaustion. The counterargument is equally simple. A market that genuinely wanted higher prices would not need five tries, and the longer price lingers below a known ceiling, the more stop-losses accumulate beneath it for sellers to hunt.
The ETF Bid That Keeps Showing Up
XRP ETFs took in $7.69 million on Friday, July 31, with Bitwise's fund accounting for $7.12 million of it, per bloomingbit's August 1 tally of the session. That print closed out July at $27.29 million in net inflows for the group, which now holds $988.78 million in assets. No weekend flow data exists, so any number circulating on Saturday or Sunday is Friday's print or older.
The same Friday session saw US Bitcoin ETFs shed $265.4 million. Money left the largest crypto funds while a token capped under $1.08 all week kept attracting it, a split we have tracked before when BTC ETF outflows ran against XRP inflows earlier this cycle. If you are new to reading these prints, our guide to Bitcoin ETF flows covers why per-session data tells you more than monthly headlines do.
Institutions do not buy five consecutive dips by accident. Someone with a longer time horizon than the weekend chart is treating everything under $1.08 as an entry, and the monthly total says July's dips were absorbed, not sold. The caveats deserve equal space, though. Friday's inflow was almost entirely one issuer, and $27.29 million across a full month amounts to under 3% growth on a $988.78 million base. This is a steady bid, and steady is the right word. It is not a wall of money, and it has not been large enough to force the breakout on its own.
The Levels That Decide the Break
The range around price is narrow enough that the next 3% in either direction changes the structure. These are the levels from our Tuesday map, still intact after the week's failures.
|
Level
|
What it represents
|
|
$1.11
|
The 20-day EMA and the trend marker XRP has to reclaim before momentum traders trust a breakout
|
|
$1.08-$1.10
|
The ceiling, five sessions of rejections and the supply shelf left by July's trapped buyers
|
|
$1.079
|
Where XRP trades now (04:21 UTC, August 2)
|
|
$1.00
|
The psychological floor and first downside checkpoint from our Tuesday level map
|
|
$0.975
|
The second downside marker and the invalidation line for the accumulation thesis
|
The asymmetry is worth sitting with. The 20-day EMA at $1.11 sits about 2.9% above the current price, while the $0.975 invalidation sits roughly 9.6% below it. A trader buying the ceiling here risks three times the distance they stand to gain before the first checkpoint, which is why the patient play has been to wait for the range to pick a side rather than front-run it.
One more scenario deserves a mention, because it is the one that hurts the most people. A push through $1.08 that stalls before reclaiming $1.11 would trap breakout buyers the same way July's higher entries trapped the sellers now defending the shelf. The reason most traders get stopped out around levels like this is that they treat the first tick above resistance as confirmation. The daily close is the filter that separates a real break from a liquidity grab, and this range has already produced one dead-cat move this week.
What Prediction Markets Price for Month-End
Polymarket's month-end XRP markets, as compiled by finbold around August 1, put 43% odds on XRP finishing August near $1.20 and 34% on a close below $1.00. Treat those figures as prediction-market pricing, positions from traders risking money on the outcome, and read our explainer on how prediction markets work if the mechanics are unfamiliar.
The distribution says something the chart does not. A market assigning 77% combined probability to either a push toward $1.20 or a drop through $1.00 is pricing resolution, and only the remaining 23% expects the current drift to survive the month. From $1.079, the $1.20 scenario is a move of roughly 11% and the sub-$1.00 scenario roughly 8%, so the crowd is split on direction while broadly agreeing the range breaks. That reading lines up with the compression argument from the chart, and it raises the cost of being positioned in the middle.
The Backdrop XRP Is Trading Inside
Bitcoin dominance stands at 56.36% as of the 04:23 UTC CoinGecko pull on August 2. Alt pairs historically struggle to lead while dominance holds above the mid-50s, because marginal capital keeps defaulting to BTC first and rotating outward only after BTC stabilizes. For XRP, the ETF bid has been strong enough to offset that tide without reversing it, which is a fair one-line summary of the whole week.
The macro calendar adds one more weight, with September rate odds near 59-60% for a quarter-point hike as of August 2, a setup our September rate-odds piece today walks through in full. For this article the relevant point is narrower. Risk appetite across crypto is being set by forces far bigger than XRP's shelf, and the first fresh evidence of how institutions handled the weekend arrives when Monday's ETF flow print publishes.
That print is the cleanest tell available. If the bid that showed up under $1.08 for a month goes quiet at the exact moment the ceiling weakens, the accumulation story loses its engine. If it shows up again, the two sides of this standoff move one session closer to a forced resolution, because thinning sell-side supply and a persistent buyer cannot coexist under one price for long.
Frequently Asked Questions
Why is XRP not going up?
Sell orders stacked between $1.08 and $1.10 from buyers who entered at higher prices in July keep absorbing each rally attempt before it can extend. Bitcoin dominance above 56% also pulls marginal capital toward BTC first, which leaves alt breakouts short of fuel. Until that supply shelf clears, rallies keep stalling at the same line.
Will XRP go up in August 2026?
Nobody can promise a direction, but prediction-market pricing from August 1 gave a $1.20 month-end finish 43% odds against 34% for a close below $1.00. That distribution favors a sharp move over more sideways drift. A daily close above $1.10 would be the earliest confirmation the bullish path is playing out.
What is a spot XRP ETF?
A spot XRP ETF is a fund that holds XRP directly and trades on a traditional stock exchange, giving investors price exposure without managing wallets or private keys. Issuers publish creation and redemption flows every trading session, which is why per-day inflow numbers exist for Friday but never for weekends. Those flow prints are the cleanest public window into institutional demand for the token.
Is XRP a good buy right now?
That depends on where you would admit the idea failed. A long entry near $1.079 risks roughly 10% to the $0.975 invalidation for a first checkpoint under 3% away at $1.11, an unattractive ratio at the middle of the range. The cleaner setups are a confirmed daily close above $1.10 or a flush toward $1.00 with the ETF bid still intact, and both are worth waiting for.
Bottom Line
XRP enters the new week at $1.079 with the same two forces pressing against each other, a ceiling that has held for five sessions and an ETF bid that funded every test of it. If buyers print a daily close above $1.10 and the next flow reports stay positive, the shelf flips from resistance to base and the 20-day EMA at $1.11 becomes the first checkpoint on the road toward the prediction market's $1.20 scenario. If $1.00 gives way instead, $0.975 becomes the line that decides how much of July's accumulation survives a real drawdown. Institutions spent a month buying what the chart could not break. This week the chart answers.
This article is for informational purposes only and does not constitute financial or investment advice. Cryptocurrency trading involves substantial risk. Always conduct your own research before making trading decisions.