

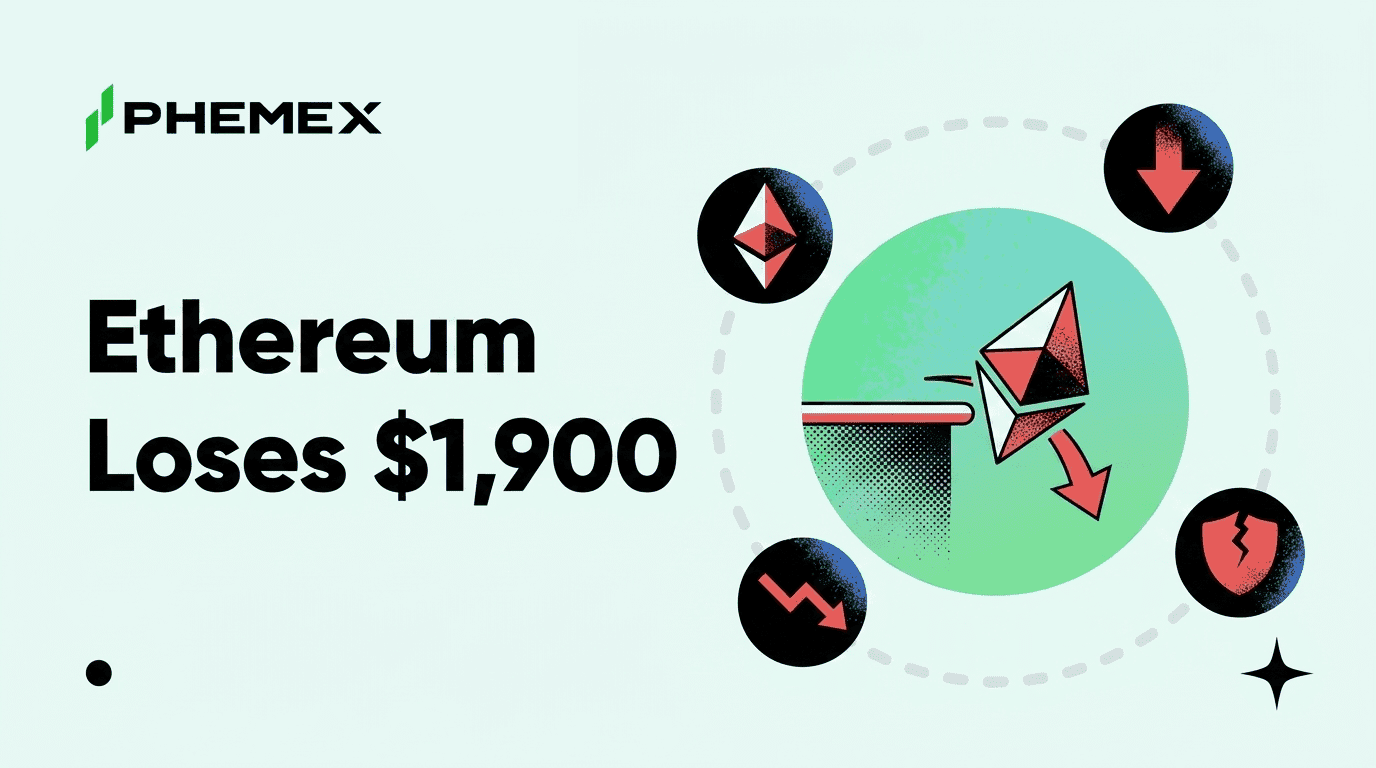
Ethereum has now spent three consecutive sessions under $1,900, and we owe readers a straight accounting. Our Thursday coverage leaned toward an upward resolution of the third $1,900 test. The market said no. Buyers carried the price to a Friday high of $1,936, sellers defended the $1,935-1,940 band for the third time in a week, and long liquidations accelerated the slide back through $1,900, with crypto.news logging a $1,878 low at 12:09 UTC on July 31. Ethereum is the blockchain that anchors most smart-contract and stablecoin activity in crypto, and its token ETH is the second-largest digital asset by market value, so a failure at a level this watched sets the tone for the entire altcoin market.
ETH Market Snapshot (CoinGecko, pulled August 2, 2026, 04:20 UTC)
|
Metric
|
Reading
|
|
Price
|
$1,878
|
|
24h change
|
+0.5%
|
|
7d change
|
-0.2%
|
|
Market cap
|
$226.7B
|
|
24h range
|
$1,823 to $1,880
|
|
Key level
|
$1,850-1,870 decision band
|
The stakes are higher than a routine range trade. ETH now sits within a dollar of Friday's liquidation low, spot funds kept buying through the entire failure, and the $1,850 band that Friday's options expiry gravitated toward is the line between a fourth attempt at $1,900 and a test of $1,800.
Where Our Thursday Call Went Wrong
On Thursday, July 30, ETH was trading at $1,911 after the Fed decision, and the setup looked constructive. Price had reclaimed the level twice intraday, ETH ETFs were on a third straight positive week, and named analysts were framing $1,800 as the floor that mattered. We treated the third test of $1,900 as one that was resolving up.
The failure took less than a day to expose that read. Friday's push to $1,936 stalled exactly where the two prior attempts died, in the $1,935-1,940 supply band. Once the rejection printed, leveraged longs stopped being support and became fuel for the move down. Long liquidations accelerated the slide through $1,900, per crypto.news reporting dated July 31, and the cascade did not stop until $1,878.
What we misread deserves naming. We weighted the fund-flow tailwind and the post-Fed reclaims heavily, and both were real, but neither had anything to say about the supply sitting at $1,935-1,940. A level that has rejected two attempts does not soften because the macro backdrop improves. It softens when the sellers there are actually absorbed, and Friday proved they had not been.
The rest of the lesson is mechanical. Three tests of the same ceiling in one week meant the traders defending it had no reason to move, while every failed attempt stacked more late longs underneath. When the third rejection came, the exit was crowded. Saturday and Sunday brought no rescue, and ETH has now logged its third consecutive session under $1,900.
And the weekend tape was messier than the closing prints suggest. CoinGecko's 24-hour range at the time of writing runs from $1,823 to $1,880, which means the market traded through the entire $1,850-1,870 band intraday before buyers pulled it back. We are not calling any support level held here. No dated daily close confirms the $1,873-1,875 shelf, and the intraday record argues against treating it as solid.
The Levels That Decide the Next Move
The level map below follows the crypto.news framework published July 31, and it is the cleanest way to track what has actually changed since Thursday.
|
Zone
|
Level
|
What it represents
|
|
Resistance
|
$2,000
|
The psychological ceiling, untouched since the slide began
|
|
Resistance
|
$1,935-1,940
|
Three rejections in one week, the proven supply band
|
|
Resistance
|
$1,906
|
First reclaim target, the minimum proof buyers need
|
|
Support
|
$1,873-1,875
|
First shelf, traded through intraday, no confirming close
|
|
Support
|
$1,850-1,870
|
The decision band, aligned with Friday's expiry gravity
|
|
Support
|
$1,800
|
The floor named by bulls, the last line before structure breaks
|
Read plainly, the map says the burden of proof now sits with buyers. A reclaim of $1,906 is the minimum signal that the fourth attempt has begun, and nothing about a $1,878 print within a dollar of Friday's low supplies that signal yet. Sellers, for their part, have not forced a daily close below the decision band either. The weekend probe to $1,823 was bought back within the same session.
That balance is exactly why the next few daily closes matter more than any intraday move. Weekend liquidity is thin, and Monday brings the first real test of conviction on both sides.
ETH Funds Took In $27.4 Million While Bitcoin Funds Bled
The strangest part of this failure is what the fund flows did while price broke down. For the week ended July 31, ETH investment products recorded a net inflow of $27.42 million while Bitcoin products bled a net $61.53 million, per Crypto Times data published August 1. On Friday itself, the session ETH broke down, ETH ETFs still added $9 million while their Bitcoin counterparts lost $265.4 million, per the same dated reporting.
That is a genuine divergence, and it extends a pattern that has been building since Morgan Stanley's MSSE fund debuted on July 28 and immediately joined the inflow column. The institutional bid for ETH exposure did not blink during the rejection, the liquidation cascade, or the weekend drift. Anyone tracking how ETF flows are read knows inflows during a falling tape usually mean allocators buying on a schedule, indifferent to what the chart did that day.
The uncomfortable half of the story is that flows did not set the price last week. Leverage did. Spot fund buying is patient capital, and patient capital does not defend intraday levels while liquidation engines are running. We covered a similar split between products earlier this summer in our piece on Bitcoin ETF outflows against HYPE and XRP inflows, and the conclusion carries over. Flow divergence tells you where conviction sits, and it tells you nothing about the next 48 hours of price.
So treat the $27.4 million as context, and weigh it against a Bitcoin backdrop that stayed heavy all weekend. BTC printed a two-week low of $62,400 on Friday and spent the weekend in the low $60,000s, weakness that fits the post-FOMC drop pattern we have tracked across the past year of Fed meetings. Our separate Bitcoin streak coverage today walks through the weekend tape session by session.
What $1,850 Decides From Here
Friday's monthly options expiry explains why this band, of all places, is the battlefield. The ETH leg settled 435,000 contracts worth roughly $830 million at 08:00 UTC on July 31, with max pain in the $1,850-1,875 region, per Deribit data cited by Crypto Times on July 31. Expiry gravity pulled price into that zone, and the expiry is now behind us, which means the band has to hold on its own merits from here.
If $1,850-1,870 holds on a daily closing basis, the setup for a fourth attempt at $1,900 is intact and arguably stronger than the third. The supply band above is well mapped, the fund bid is verified and growing, and a market that absorbs three failures without losing its floor is compressing rather than collapsing. A post-expiry hold would also upgrade the zone itself, since a price that stays in the band after the pin expires reflects genuine demand, and a pinned price reflects only dealer hedging. The fourth test would begin with a $1,906 reclaim.
If the band gives way on a daily close, $1,800 is the next stop, and the backdrop makes that scenario worth respecting. August options positioning in Bitcoin shows downside-protection interest clustered around $60,000, per Crypto Times data dated August 1, meaning derivatives desks are paying for insurance rather than upside. An ETH breakdown into that risk posture would likely overshoot before it stabilized.
The macro calendar frames the whole question, with September hike odds near 59-60% as of August 2, a backdrop covered in full in today's macro piece on the GDP miss and what the September odds mean. Friday's July jobs report on August 7 is the week's binary event for every risk asset, ETH included.
Frequently Asked Questions
Why is ETH going down today?
ETH failed its third attempt to break the $1,935-1,940 resistance band on Friday, July 31, and long liquidations accelerated the drop back through $1,900. The selling came from leveraged positioning, while ETH investment products actually recorded net inflows through the decline. As of the August 2 pull at 04:20 UTC, ETH trades near $1,878, up 0.5% over 24 hours.
What is the next support level for Ethereum?
The first shelf sits at $1,873-1,875, but it has not produced a confirmed daily close and traded through intraday over the weekend. The band that matters is $1,850-1,870, and below that the widely watched floor is $1,800. A daily close under $1,850 would put $1,800 in play quickly given thin weekend liquidity.
Will Ethereum go back above $2,000?
Nobody can time that, and anyone offering a date is guessing. The sequence required is visible, though. ETH needs a daily reclaim of $1,906, then an actual break of the $1,935-1,940 band that has rejected three attempts, before $2,000 comes back into play as a live target.
Why are Ethereum ETF inflows rising while the price falls?
Institutional allocators buy on mandates and schedules, so their inflows continue through weak price action, while short-term price is set by leveraged traders who respond to levels and liquidations. For the week ended July 31, ETH products took in $27.42 million even as the price lost $1,900. Historically that mix has favored patient accumulators, but it offers no protection against further downside first.
Bottom Line
If ETH closes daily candles inside or above the $1,850-1,870 band this week, the third failure reads as compression under a mapped ceiling, and a reclaim of $1,906 would start the fourth test with verified fund inflows behind it. If $1,850 breaks on a daily close, the $1,800 test begins with derivatives desks already paying for downside protection around $60,000 Bitcoin, and overshoot risk is real. The honest read after a failed call is to demand more proof, and the proof now is simple. Watch the daily closes against $1,850, watch the $1,906 reclaim, and watch Friday's jobs report, because the level that decides ETH's August may end up being decided in the labor data.
This article is for informational purposes only and does not constitute financial or investment advice. Cryptocurrency trading involves substantial risk. Always conduct your own research before making trading decisions.