


Bubblemaps is an on-chain analytics platform that renders a token's holder distribution as connected bubbles, showing which wallets are linked and how concentrated a supply really is. BMT is its native utility and governance token, a LayerZero omnichain asset that lives on Solana and bridges to BNB Chain. Interest in it jumped in late August 2026 after a single-session move of more than 50%.
Most pages about BMT copy the same allocation table off the project's own site and stop there. This one runs the contract calls, reconciles the supply across both chains, and measures where the volume genuinely trades, and three of those checks returned results that no marketing page mentions.
Bubblemaps at a Glance
Metric | Details |
Token name | Bubblemaps |
Ticker | BMT |
Blockchain | Solana (native SPL mint), bridged to BNB Chain via LayerZero |
Solana mint address | FQgtfugBdpFN7PZ6NdPrZpVLDBrPGxXesi4gVu3vErhY |
BNB Chain contract | 0x7d814b9eD370Ec0a502EdC3267393bF62d891B62 |
Total supply | 1,000,000,000 |
Circulating supply | 727,680,980 (72.77%) |
Launch | Token generation event Tuesday 11 March 2025 |
Core narrative | Holder-concentration forensics and wallet-cluster visualisation |
Token type | LayerZero omnichain utility and governance token |
Market cap | $17,750,848 (CoinGecko, pulled 11:57 UTC Wednesday 26 August 2026) |
Primary risks | Active Solana mint authority, roughly 99% of volume off-chain, same-name copies on BNB Chain, monthly vesting releases running to 2029 |
Availability on Phemex | Not listed. BMT has no Phemex spot pair and no Phemex perpetual futures market |
What Is Bubblemaps?
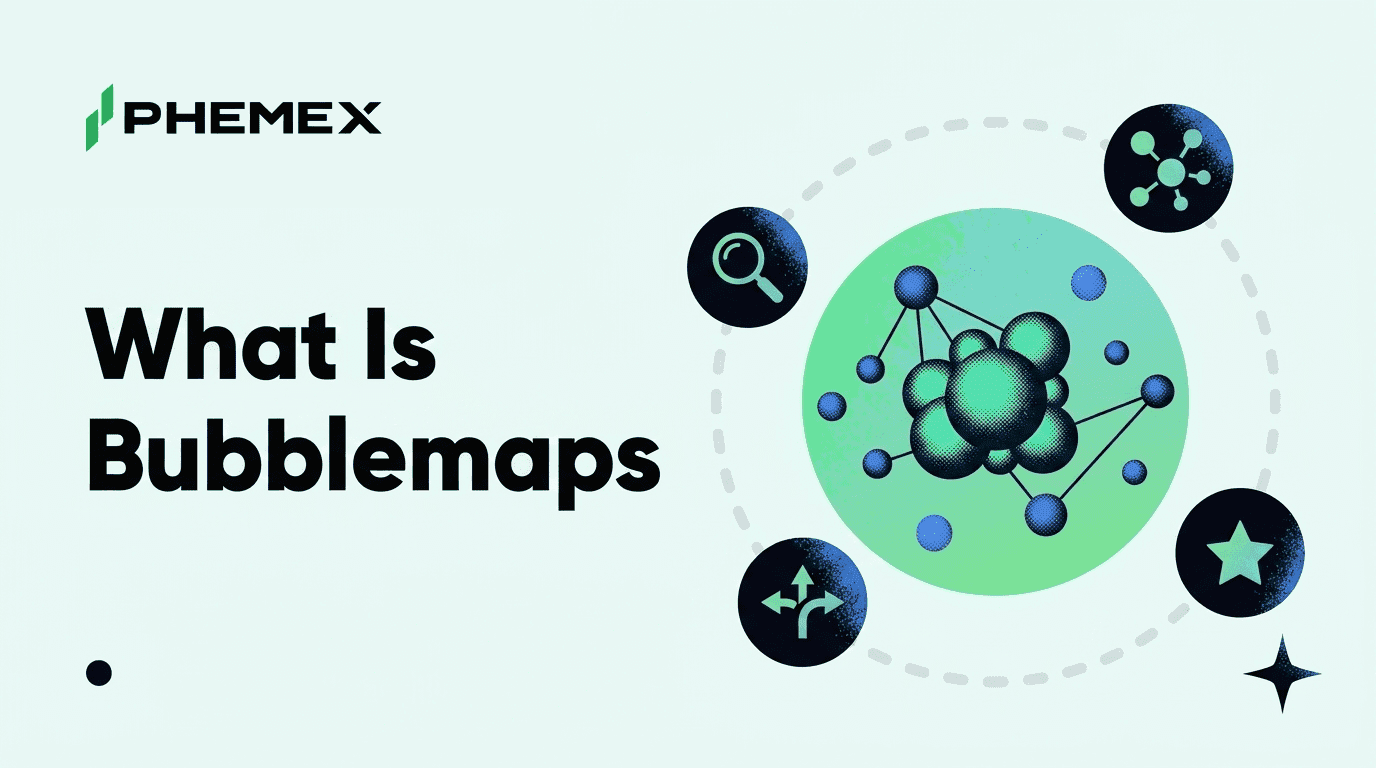
The project describes itself as a visual engine for on-chain intelligence, and that description is literal. Feed it a contract address and it returns a map where every bubble is a wallet, bubble size is the share of supply held, and lines between bubbles mean those wallets have transacted with each other. A supply spread across thousands of unconnected holders looks like scattered confetti, while a supply where forty wallets funded from one address hold most of the float looks like a single dense knot. You see it in about two seconds without reading a block explorer.
That shortcut is the entire product. Reading holder concentration off a raw explorer means exporting a holder list, tracing funding transactions one at a time and building the cluster by hand, and Bubblemaps compresses hours of that into an image. Which is why it ended up embedded inside tools traders were already using, DEXScreener, CoinGecko, Etherscan and Pump.fun among them, rather than living only on its own site. Its maps cover nine chains, Solana and Ethereum among them.
The BMT token gates the paid tier. Holding it opens AI-assisted clustering, wallet profit-and-loss computation, cross-chain tracing and maps of a token's top 1,000 holders rather than the free top 150, and it carries governance weight over the Intel Desk, the community-run queue where holders propose investigations and vote on which suspicious tokens get looked at first.
Bubblemaps was founded in late 2022 and the token arrived roughly two and a half years later. A companion profile of the company's co-founder covers the people and the business, while this piece stays on the token and the chain data.
Why Did BMT Become Popular?
BMT closed Tuesday 25 August 2026 at $0.023043, up 52.42% from Monday 24 August's close of $0.015118. That is a completed, settled daily close rather than a rolling window, which matters because the two prior Tuesday closes ran $0.023628 on 11 August and $0.016312 on 18 August. The token had been drifting sideways in the mid-$0.015 range for four sessions before it moved.
And the search for a reason comes up empty. No listing announcement, no product launch, no partnership and no funding news landed in the 25 to 26 August window, and the project's own blog had not posted since 19 August. The move was mechanical rather than fundamental.
The shape of it says short squeeze, and the derivatives data behind the candle says so more clearly than the candle does. A single four-hour bar on Tuesday 25 August carried price from $0.016178 to $0.022436, a 38.7% move inside four hours, and open interest across perpetual venues sat flat near $2.6 million while that bar printed. Spot buying into a thin order book moved the price first. Open interest then chased it to $6.67 million, the funding rate flipped to -0.86%, and the long/short account ratio sat between 0.64 and 0.80, meaning most accounts were positioned short into a rising market and paying for the privilege. Shorts covering into an illiquid book is what produces a candle that steep.
This was the second such event in three weeks. BMT closed Sunday 9 August 2026 at $0.032931, up 150.9% from Saturday 8 August's close of $0.013127, and by Sunday 16 August's close of $0.014899 it had given back 91% of that gain in seven sessions. It sits 92.3% below its all-time high of $0.317341, set on 18 March 2025.
A thin float, a heavily shorted book and low pooled liquidity produce violent upward moves that do not hold, and the reader who buys the second day of one of these is buying from the person who bought the first.
How Does the BMT Token Work?
BMT is an omnichain token built on LayerZero's OFT standard, and the project's own cross-chain documentation is explicit about the mechanism. Moving BMT between chains burns the tokens on the source chain, passes a message through LayerZero, and mints the same quantity on the destination chain. There is no wrapped asset and no locked collateral pool. Supply moves rather than duplicates.
The contract calls confirm the design and, more usefully, they identify which contract is real. The Solana mint carries 9 decimals and a supply of 504,840,361.56. The BNB Chain contract returns name "Bubblemaps", symbol "BMT", 18 decimals, and a total supply of 495,159,148.70, and a `supportsInterface(0x80ac58cd)` call against it reverts, which is what a plain token contract with no ERC-165 support does.
Then the two figures sum to 999,999,510.26, closing to within 490 tokens of the documented 1,000,000,000 total.
That reconciliation is the strongest canonicity evidence available on this token. A burn-and-mint bridge keeps the sum of supplies across every chain equal to the fixed total, so two contracts adding up to the stated maximum with a rounding-scale remainder are almost certainly the two halves of one asset, and two that each claim the full supply are not. The check costs four RPC calls and settles a question that reading marketing copy never will.
On distribution, the project documents a nine-way allocation split. Airdrop takes 22.17%, Ecosystem 21.30%, Investors 19.35%, Liquidity 12.18%, Team 9.00% and Protocol 6.00%, with the remaining 10.00% divided across a launchpad sale, a holder airdrop and marketing arranged with a major centralised venue. Team tokens carry a 12-month cliff followed by 36 months of vesting. The tokenomics documentation states that total supply becomes fully vested four years after listing, which places the final release in March 2029.
Circulating supply stood at 727,680,980 against that 1,000,000,000 total at the 26 August 2026 pull, so roughly 27% of supply is still ahead of the market on a schedule that runs for another two and a half years. Anyone modelling this token needs the vesting schedule in the model, and not the price chart alone.
Bubblemaps vs Bitcoin
Comparing a $17 million analytics token to Bitcoin is not a comparison of rivals. It places this asset somewhere specific on the risk curve, which is the only useful thing a reader can take from the comparison.
Category | Bubblemaps (BMT) | Bitcoin (BTC) |
Main identity | Utility and governance token for an on-chain forensics product | Bearer digital commodity and monetary network |
Blockchain | Runs on Solana and BNB Chain, owns neither | Its own base layer |
Core value driver | Paid-tier demand and governance participation | Monetary demand, scarcity, network security |
Supply model | 1,000,000,000 fixed, 72.77% circulating, vesting to 2029 | 21,000,000 capped, roughly 95% already issued |
Market maturity | Listed March 2025, ranked outside the top 900 by market cap | Sixteen-year history, deepest liquidity in the asset class |
Where it trades | Almost entirely on centralised venues, with very shallow on-chain pools | Every venue, spot and derivatives, plus regulated ETFs |
Risk profile | Micro-cap, thin book, squeeze-prone, supply overhang ahead | Volatile, but liquid enough to exit at size |
The liquidity row is the one that matters. Bitcoin's risk is that the price falls, while BMT's risk is that plus the possibility that the exit is thinner than the entry looked.
What Can Move the BMT Price?
Derivatives positioning
The 25 August move showed the mechanism clearly. When funding is deeply negative and the account ratio is skewed short, the fuel for an upward move is already loaded, and a modest amount of spot buying can set it off. That works in reverse too. A crowded long book on a token this size unwinds every bit as fast.
Monthly vesting releases
Roughly 272 million tokens remain locked on a schedule running to March 2029, and every scheduled release adds sellable supply against a market cap under $20 million. Vesting dates are the most predictable bearish catalyst an early-stage token has.
The forensics news cycle
Bubblemaps generates attention by publishing investigations, and a finding that gets picked up widely pulls new users toward the paid tier that BMT gates. This is the one driver where the product and the token are genuinely connected.
Solana meme-coin activity
The maps get used most where new tokens launch fastest. When a call from a well-followed Solana trader creates a token thousands of people want to inspect within the hour, demand for holder-concentration tools rises with it, and when launch activity cools that demand cools too.
Listing and venue changes
A micro-cap that trades almost entirely on centralised venues is hostage to those venues, because gaining or losing a major market changes the accessible liquidity far more than it changes anything about the protocol. BMT is not available on Solana decentralised markets at anything close to the depth its reported volume implies.
Risks of Buying or Trading Bubblemaps
The Solana mint authority is active
This is the single most important thing on this page. The BMT mint's freeze authority is null, which is good, but its **mint authority is set to `9xNEePFZEiSW4V8UMpg2JHREw6pJBM1ZHc8qkWvQK8Ys` and is not revoked.**Whoever controls that key can mint additional BMT on Solana.
The reading that fits the evidence is benign. A LayerZero burn-and-mint bridge needs a live minter on each chain to credit tokens arriving from the other side, the project documents exactly that design, and the cross-chain supply sum reconciles to within 490 tokens of the maximum, which it would not if extra supply were being issued. But a plausible explanation is not a revocation, and any reader told this token has "renounced" its authorities was told something untrue.
It cuts the other way too. Null authorities are necessary but never sufficient, and non-null authorities are not automatically fatal, which is why this token fails half a standard safety heuristic for a defensible reason. The SPL token documentation describes what these authorities actually permit, and reading it beats trusting a green checkmark on a scanner.
Roughly 99% of the volume is not on-chain
Reported 24-hour volume ran $171,252,453 on CoinGecko against $145,745,084 on CoinPaprika, a 1.18x spread between feeds. Against that, the eight live Solana pools for BMT turned over $1,104,841 in the same window on $428,150 of total pooled liquidity.
On-chain trading is therefore between 0.6% and 0.8% of reported volume, which means the price you see is set almost entirely on centralised order books and a decentralised exit at size does not exist. The reported volume tells you nothing about how much BMT you could personally sell without moving the market.
Same-name copies on BNB Chain
Two BNB Chain contracts carry the name "Bubblemaps" and neither is the real token. 0xb6C51407Aed9F260949Fc703d91eE72087347dC3 returns name "Bubblemaps", symbol "BMT", 18 decimals and a total supply of exactly 1,000,000,000, which matches the genuine figure precisely and makes it the more dangerous of the two. 0xa4fb544584b0e91b9012eb03f6c949dd963ddb62 returns name "Bubblemaps", symbol "$BMT" and a supply of one trillion.
A copy that reproduces the correct name, ticker, decimals and total supply cannot be caught by reading token metadata, which is exactly why the cross-chain reconciliation matters. The same discipline applies to verifying any token against its lookalikes.
Holder concentration
Top wallets are reported to hold about 76.3% of supply. That figure could not be reproduced from a public Solana endpoint for this piece and it is presented as a reported number rather than a verified one, so treat it accordingly.
It is an awkward number for a company whose product exists to flag holder concentration in other people's tokens. On its own it is not evidence of wrongdoing, since locked team and ecosystem allocations sit in identifiable wallets and count toward exactly this measure. But a reader running Bubblemaps against BMT itself should expect a dense map.
The two market-cap feeds disagree by 2.8x
CoinGecko reported a market cap of $17,750,848 and CoinPaprika reported $6,257,072 for the same asset within three minutes of each other, while their prices differed by 0.015%. A 2.8x gap on identical prices is not a price disagreement. It is a circulating-supply disagreement.
Dividing CoinPaprika's market cap by its own price implies a circulating basis of roughly 256.2 million tokens, which is about a quarter of total supply and matches where BMT's float sat around its March 2025 launch. CoinGecko's basis of 727,680,980 multiplied by price returns $17.78 million against its reported $17.75 million, so that basis reconciles and the other one appears frozen at a launch-era figure. Use the feed whose arithmetic closes, and always check that it does.
It is a micro-cap with a squeeze history
Two violent upward moves in three weeks, neither with an identifiable catalyst and both giving most of the gain back, describes a market that trades on positioning rather than on the business. Position size matters more here than direction.
How to Research Bubblemaps Safely
The checklist below works on any token, and BMT is a useful test case because several standard shortcuts fail on it.
Sort by volume and holders, not by liquidity. Liquidity rankings surface whichever pool was seeded last, which is how copies reach the top of a search, and volume and holder counts are much harder to fake cheaply.
Reconcile supply across every chain the token claims. Add the total supplies and compare the sum to the documented maximum, which a burn-and-mint token should close to within rounding. A sum above the maximum means at least one contract is a copy, and a sum far below it means you are missing a deployment.
Check mint and freeze authority, then keep going. Read the actual result rather than the badge a scanner puts next to it. A non-null mint authority on a bridged token may be the bridge minter, and a null one proves only that this particular attack is unavailable.
Check pool age against the documented launch. BMT's oldest Solana pools date to the second week of March 2025 and the project documents a token generation event on Tuesday 11 March 2025, and those two facts agreeing is meaningful. A pool a few days old under a token claiming an eighteen-month history is a copy.
Compare two independent feeds before trusting any number. Do it for price, market cap and volume separately, because they fail differently. Prices converge across feeds because arbitrage forces them to, while market caps diverge because circulating-supply bases are maintained by hand and go stale.
Measure on-chain volume against reported volume. Sum the 24-hour turnover of the token's actual pools and compare, because the ratio tells you where the real market is. On BMT the answer changes how you would size a position.
Is Bubblemaps a Good Investment?
The product is real, which already separates BMT from most tokens in its market-cap range. Bubblemaps solves a problem people genuinely have, its maps sit inside tools traders already use, and the paid tier gives the token a use beyond speculation.
The token is a harder case than the product. Its price is set almost entirely on centralised venues, the on-chain market is too shallow to exit through, 27% of supply is still vesting into 2029, and the last two significant rallies were positioning unwinds that reversed rather than repricings that held.
The assessment I can defend is that BMT is a small speculative position sized for a total loss rather than a core holding, and that anyone taking it is buying a thinly traded micro-cap where the derivatives book drives the price more than the business does. No price prediction belongs here, because the variables that would move it are vesting timing, the volume of Solana launch activity, and how short the market happens to be in a given week, and nobody forecasts the third one.
Final Thoughts
The most interesting finding on this token is not its price. It is that a firm whose product measures holder concentration carries a reported 76% top-wallet figure of its own, that its token's mint authority is live, and that under 1% of its enormous reported volume touches a chain anyone can audit. None of that is hidden, all three are one API call away, and none of them appears on the pages that rank for this token's name.
Watch the vesting calendar through March 2029, watch funding rather than price when BMT moves sharply, and treat any third rally with no announcement behind it as the same trade that already round-tripped twice in August 2026. The method matters more than the token does, so run those six checks on the next thing you are about to buy.
Frequently Asked Questions
Is Bubblemaps (BMT) available on Phemex?
No. BMT has no Phemex spot pair and no Phemex perpetual futures market. A /futures/ page rendering for a ticker is not evidence of a listing, because those pages render for tickers that do not exist at all.
What is the real Bubblemaps contract address?
The native token is the Solana SPL mint FQgtfugBdpFN7PZ6NdPrZpVLDBrPGxXesi4gVu3vErhY, bridged to BNB Chain as 0x7d814b9eD370Ec0a502EdC3267393bF62d891B62. At least two other BNB Chain contracts use the Bubblemaps name and one copies the genuine total supply exactly.
Can Bubblemaps see who owns a wallet?
No, and the distinction matters more than most readers assume. The tool shows that wallets are connected by transactions and how much each one holds, which is a clustering claim rather than an identity claim. Attaching a name to a cluster takes separate evidence, and treating a bubble map as proof of who someone is has produced public disputes before.
Why do BMT market cap figures differ so much between sites?
Because the sites use different circulating-supply figures, not different prices. Divide any reported market cap by that site's own price to recover the supply basis it is using, then check that basis against the token's documented vesting schedule. The one that reconciles is the one to trust.
This article is for informational purposes only and does not constitute financial or investment advice. Cryptocurrency trading involves substantial risk. Always conduct your own research before making trading decisions.