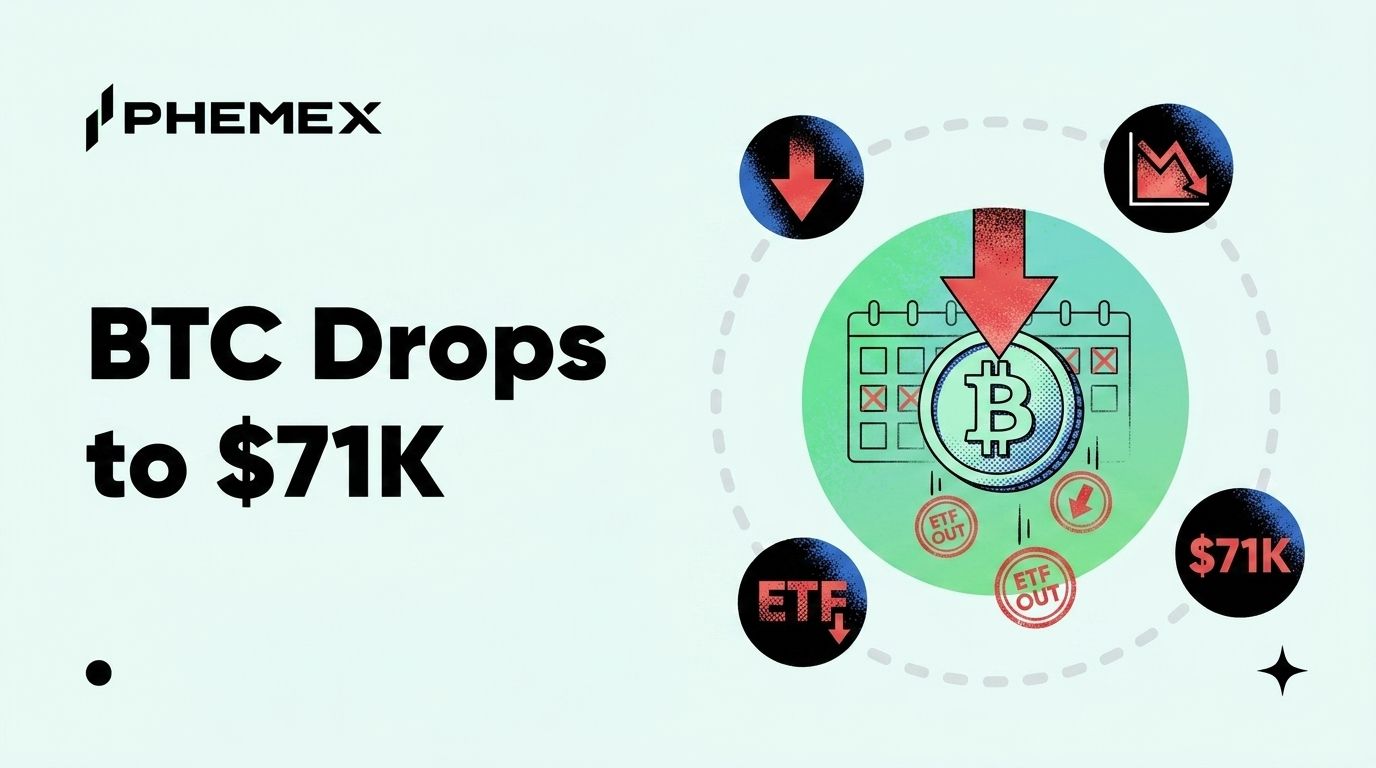

The U.S. Dollar Index reversed sharply from above 100 to around 99.12 on March 23 after President Trump announced "productive conversations" with Iran about ending the four-week-old military conflict, sending Brent crude down more than 7% in a single session. The 10-year Treasury yield eased to 4.35% by March 25, pulling back from eight-month highs above 4.4% that had been driven by war-related inflation fears. Bitcoin climbed to $71,674 on Tuesday, recovering 5% from a dip below $68,000 the day before.
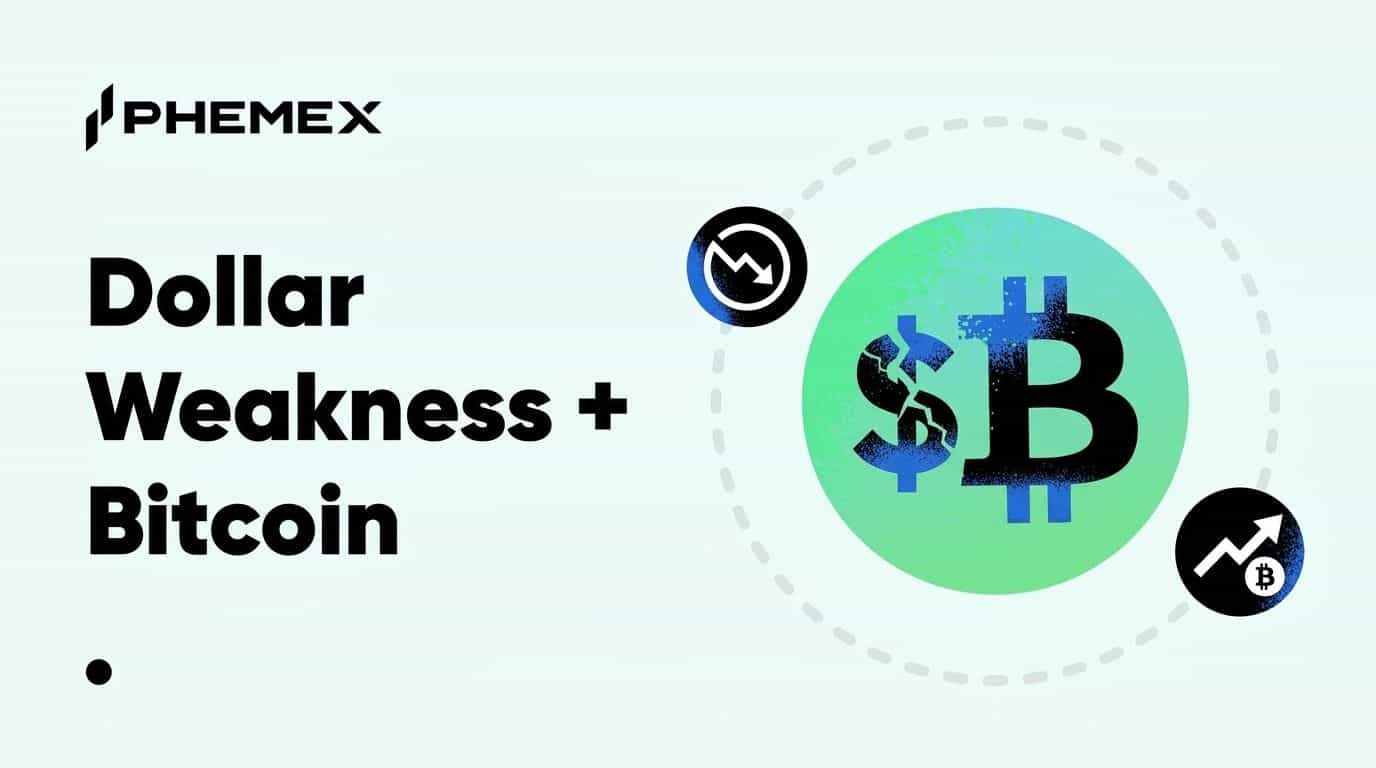
That three-way move is not a coincidence. Dollar down, yields down, Bitcoin up is the pattern that has preceded every major BTC rally of the past six years, and the current macro setup is starting to look like the early stages of something traders have seen before.
What Is the DXY and Why Does It Move Opposite to Bitcoin?
The U.S. Dollar Index (DXY) measures the dollar's value against a basket of six major currencies, with the euro carrying the heaviest weighting at 57.6%. When the DXY rises, the dollar is strengthening relative to other fiat currencies. When it falls, the dollar is losing relative purchasing power.
Bitcoin's relationship with the DXY runs through a straightforward mechanism. A weaker dollar means global investors need fewer units of their local currency to buy BTC, and it signals capital leaving dollar-denominated safe havens for risk assets and inflation hedges. The historical correlation coefficient sits around -0.58, meaning they move in opposite directions more often than not, though the relationship breaks down during liquidity crises when everything sells off together.
The reason this matters more than most macro indicators is timing. DXY moves tend to precede BTC moves by days to weeks. Traders watching the dollar index get an early read on where crypto capital flows are heading before those flows show up in Bitcoin's price.
The Historical Scoreboard: DXY Drops and BTC Rallies
The pattern is consistent enough to build a trading thesis around, though sample sizes are small and every cycle had unique catalysts.
|
Period
|
DXY Move
|
BTC Price at DXY Peak
|
BTC Price 6 Months Later
|
BTC Return
|
|
March 2020 - January 2021
|
102 to 89 (-12.7%)
|
~$10,000
|
~$40,000
|
+300%
|
|
September 2022 - July 2023
|
114 to 100 (-12.3%)
|
~$19,000
|
~$30,000
|
+58%
|
|
October 2023 - December 2023
|
107 to 100 (-6.5%)
|
~$26,000
|
~$73,000 (March 2024)
|
+180%
|
|
January 2026 - March 2026
|
101 to 99 (-2% so far)
|
~$72,000
|
?
|
?
|
The 2020 episode remains the most dramatic example of the pattern in action. The Fed launched emergency QE, the dollar cratered from 102 to 89, and BTC went from $3,800 to $69,000 over the following 20 months. The DXY decline was the structural backdrop for the entire bull market.
The 2023 move was faster. The DXY dropped 6.5% in three months as the market priced in Fed rate cuts, and BTC rallied from $26,000 to $73,000 by March 2024. That rally happened before a single rate cut was actually delivered. The dollar's decline was the signal, not the Fed's actions themselves.
Why the Dollar Is Weakening Right Now
Three forces are pushing the DXY lower simultaneously, and the combination is what makes this setup notable.
Oil prices collapsing on ceasefire hopes is the immediate catalyst. The DXY had surged above 101 in mid-March as the Iran conflict drove crude higher and created safe-haven dollar demand. When Trump's ceasefire rhetoric hit on March 23, oil dropped 13% intraday and the dollar's war premium evaporated. If the Strait of Hormuz reopens to tanker traffic, the dollar loses its primary near-term support.
Bond yields are easing. The 10-year pulled back to 4.35% after hitting eight-month highs, reducing the carry trade incentive that attracts capital into dollar assets. Lower yields make holding non-yielding assets like Bitcoin relatively more attractive.
And the Fed pivot expectation is building. Markets price one to two rate cuts for the second half of 2026, with J.P. Morgan expecting Warsh to push for cuts after taking office based on his "AI productivity" thesis. Warsh replaces Powell on May 15 if confirmed, and the market is already front-running the policy shift.
The Warsh Variable: Rate Cuts with Balance Sheet Hawkishness
Kevin Warsh complicates the simple "weak dollar = Bitcoin moon" narrative, and traders who ignore this are missing half the picture.
Warsh is the most prominent QE critic in modern Fed history. He opposed QE2, argued pandemic-era money printing directly caused the 2021-2022 inflation spike, and has consistently pushed for a smaller Fed balance sheet. That makes him likely to accelerate balance sheet reduction even as he cuts short-term rates. BTC dropped 6% the day Trump first mentioned Warsh's name on January 30, which tells you the market's initial read was cautious.
For Bitcoin, this creates a split signal. Rate cuts historically weaken the dollar and send capital into risk assets, but balance sheet reduction drains liquidity, which is historically bearish for crypto. The bull case is that Warsh cuts rates aggressively enough to weaken the dollar while balance sheet reduction proceeds gradually. The bear case is that he tightens liquidity faster than rate cuts can offset. Previous DXY-BTC correlations did not have this kind of policy split as a variable, so historical averages come with a larger asterisk than usual.
The "Anti-Dollar Trade" and What Is Different This Cycle
The DXY is down 4.71% over the past 12 months despite the U.S. running massive fiscal deficits and a military conflict that would traditionally strengthen the dollar through safe-haven flows. That divergence suggests structural weakness beyond any single catalyst, with tariff uncertainty, ballooning government debt, and growing international reserve diversification all contributing. Bitcoin is increasingly part of that conversation.
In 2020, BTC was a retail-driven speculative asset that happened to benefit from dollar weakness. In 2026, institutional allocators with Bitcoin ETF exposure are explicitly using it as a dollar debasement hedge. MicroStrategy (now Strategy) holds over 440,000 BTC on its balance sheet, and sovereign wealth funds across the Middle East and Asia have disclosed crypto allocations. The floor of demand during dollar weakness episodes is structurally higher than in any previous cycle.
What Levels to Watch From Here
The DXY is currently around 99.65. If it breaks below 98 and holds, the technical picture opens up for a move toward 95-96, a major support zone since 2022. That kind of decline (4-5% from here) would put dollar weakness squarely in the historical range that has preceded 40%+ BTC rallies within six months.
For Bitcoin, the $70,000-$72,000 zone has held as support through three consecutive days. The key downside level is $65,600, the March 2026 range low. A sustained break below that during dollar weakness would break the historical pattern entirely.
The catalysts ahead are stacked. The Warsh confirmation vote, any concrete Iran ceasefire deal that sends oil below $90, and the next FOMC meeting could all accelerate the DXY decline and test the correlation thesis in real time.
Frequently Asked Questions
Does a weak dollar always mean Bitcoin goes up?
Not always, but the correlation is one of the strongest in crypto macro analysis. BTC has rallied during every major DXY decline of 5%+ since 2020, with returns ranging from 58% to 300% within six months. The pattern breaks during systemic liquidity crises when both the dollar and Bitcoin fall together before the inverse relationship reasserts.
What DXY level would signal a major Bitcoin rally?
Historically, sustained DXY moves below 97-98 have coincided with the strongest BTC rallies. The DXY currently sits around 99.65, so a 2-3% further decline would enter that zone. The speed of the decline matters as much as the level, because a gradual drift lower has less impact on capital flows than a sharp breakdown.
How does oil price affect the DXY Bitcoin correlation?
Falling oil prices reduce inflation expectations, which lowers bond yields and weakens the dollar. That sequence creates the conditions under which capital flows out of dollar-denominated safe havens and into risk assets like Bitcoin. The current Iran ceasefire talks are the most significant near-term driver of oil prices, and by extension, the strongest variable affecting the DXY-BTC correlation right now.
Will Kevin Warsh's Fed be good or bad for Bitcoin?
It depends on how he balances rate cuts against balance sheet reduction. If he cuts rates faster than he shrinks the balance sheet, the net effect weakens the dollar and favors Bitcoin. If he prioritizes aggressive quantitative tightening, liquidity could tighten even as rates fall. His first policy actions after May 15 will clarify the direction.
Bottom Line
The DXY-BTC inverse correlation is not a theory. It is a pattern with a documented track record across four episodes since 2020, each with different catalysts but the same directional result. The current setup puts BTC in the early stages of a macro environment that has historically produced 40-180% returns within six months of a DXY peak.
Watch three variables. The DXY at 98, BTC at $65,600, and the Warsh confirmation timeline. If all three break in the bullish direction, the macro signal for a second-half 2026 rally becomes the strongest since the 2020 QE expansion. If Warsh drains liquidity faster than rate cuts can offset, this cycle breaks the pattern. The dollar will tell you which scenario is playing out before Bitcoin does.
This article is for informational purposes only and does not constitute financial or investment advice. Cryptocurrency trading involves substantial risk. Always conduct your own research before making trading decisions.