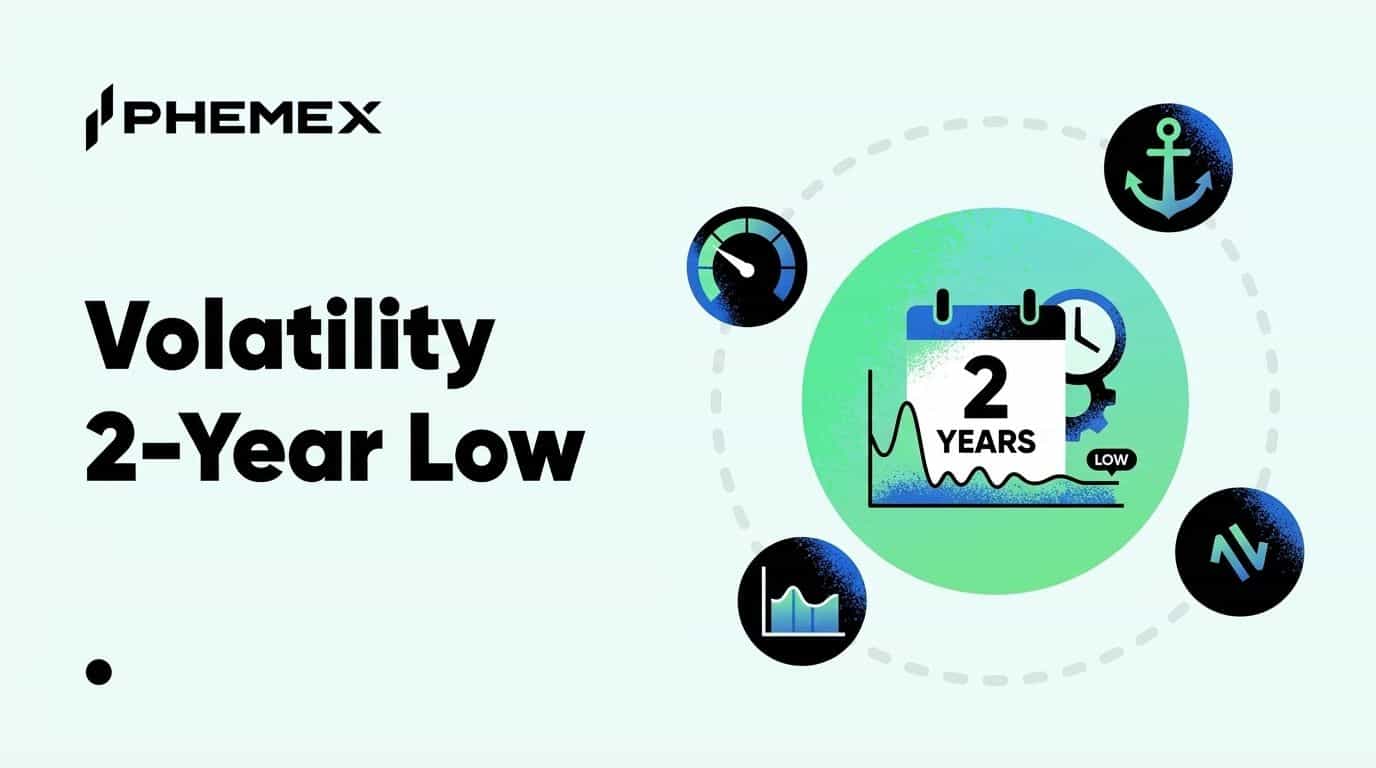
Bitcoin's 30-day implied volatility index fell to 51.28% in the first week of April 2026, the lowest reading since February and part of a broader compression trend building for months. BTC has traded between roughly $66,000 and $70,000 for over 50 days now, with daily ranges shrinking to the point where the Bollinger Bandwidth on the daily chart is narrower than at any point since early 2024. The 14-day Average True Range has been declining steadily since mid-March, confirming what any trader watching the charts already feels. This is the quietest Bitcoin market in two years.
Quiet markets do not stay quiet, and every comparable volatility compression in Bitcoin's history resolved with a move of at least 40%. Three of the four major squeezes since 2020 resolved to the upside, so the question is not if a big move is coming but when it starts and which direction it goes.
What the Volatility Indicators Are Showing Right Now
Three independent volatility measures are all pointing to the same conclusion, and that convergence is what makes this setup worth paying attention to.
Bollinger Bandwidth. The Bollinger Bands on Bitcoin's daily chart have compressed to less than $3,500 between upper and lower bands, the tightest configuration since the July 2025 squeeze that preceded a swing from $100,000 to $126,000. When the bands contract this aggressively, the statistical probability of a large directional move within the next 7 to 14 trading days rises significantly. The bands themselves do not predict direction, only magnitude.
Average True Range (ATR). The 14-day ATR has been falling since Bitcoin's last meaningful move in mid-February when BTC dropped from $72,000 to $66,000, and daily candle ranges have shrunk progressively since. A declining ATR creates a coiled-spring dynamic where the eventual breakout tends to be outsized relative to the preceding calm.
The gap between implied and realized volatility tells the same story. Bitcoin's implied volatility on 30-day options contracts sits near 51%, while realized volatility has compressed toward 27% on longer-term measures according to VanEck research. When implied stays elevated above realized, options traders are pricing in a move that spot has not yet delivered, and that gap typically closes with a sharp directional break rather than a gradual drift.
What Happened After the Last Four Major Squeezes
The current setup is not new. Bitcoin has printed comparable volatility compressions four times since 2020, and the pattern that followed each one is remarkably consistent.
|
Period
|
Volatility Signal
|
BTC Price at Squeeze
|
What Followed
|
Magnitude
|
|
July 2020
|
30-day vol at 0.04
|
~$9,200
|
Rally to $69,000 ATH (Jan 2021 peak)
|
+300% over 6 months
|
|
January 2023
|
Quarterly vol at multi-year lows
|
~$16,500
|
Rally to $31,000 by July 2023
|
+88% over 6 months
|
|
September 2023
|
Realized vol hit 13 consecutive lows
|
~$27,000
|
Rally to $73,000 by March 2024
|
+170% over 5 months
|
|
July 2025
|
Bollinger squeeze, bands < $5,000
|
~$115,000
|
Swing to $126,000 ATH, then correction to $67,000
|
+10% up, then -47% down
|
The first three resolved with explosive upside moves ranging from 88% to 300%. The July 2025 squeeze is the outlier. It produced a modest new high followed by a severe correction, which is a reminder that low volatility guarantees a big move but not a bullish one. Roughly 40% of Bitcoin squeezes historically have broken to the downside, making directional confirmation from other indicators essential before committing capital.
The takeaway is not "buy because volatility is low" but that this calm is temporary, and traders who are not positioned for increased volatility in either direction are the ones most likely to get caught offside.
Why This Squeeze Has Built Up for So Long
Most volatility compressions resolve within two to three weeks. This one has persisted for over 50 days, and there are structural reasons why.
Bitcoin now trades in lockstep with macro risk assets more than at any point in its history, and institutional capital through spot ETFs has made BTC increasingly sensitive to Treasury yields, Fed policy, and geopolitical headlines. When macro uncertainty is high but unresolved, as it is right now with U.S.-Iran tensions and tariff escalation, institutional players hedge rather than commit, and that suppresses volatility.
Source - Vanech
The Q1 2026 drawdown of nearly 23% from the cycle high already flushed a significant amount of leveraged positioning, and funding rates across major exchanges have been negative or flat for weeks. Without a leverage overhang to unwind or a clear bullish catalyst, spot buyers are accumulating slowly rather than bidding aggressively.
The result is a market stuck in equilibrium, but equilibriums in Bitcoin never last and they break harder the longer they persist.
What Could Break the Range to the Upside
Bullish catalysts are stacking up in the background even as price action stays flat.
Fed rate cuts. The market is pricing one to two cuts for the second half of 2026. If the Fed signals an accelerated timeline at any upcoming meeting, or if inflation data surprises to the downside, the liquidity narrative shifts overnight. Bitcoin rallied 75% from September 2023 to January 2024 in a period when rate cut expectations were building, and a similar repricing of monetary policy expectations could trigger the same kind of move.
Regulatory clarity. The March 2026 SEC/CFTC joint ruling that classified 16 major tokens as digital commodities has not been fully priced in because it was overshadowed by the FOMC selloff and geopolitical noise within the same week. Institutional allocators who were waiting for regulatory certainty now have it, and that capital tends to arrive in waves over months rather than all at once.
ETF flow acceleration. Spot Bitcoin ETFs have maintained strong holdings despite the Q1 drawdown, and analysts at CoinDesk expect aggregate inflows to exceed $180 billion in 2026. A resumption of positive weekly net flows would provide steady buying pressure that could push BTC above the $70,000 resistance level and trigger momentum-based buying.
What Could Break the Range to the Downside
Honesty about the bear case matters more than being bullish for its own sake.
Tariff escalation remains the biggest macro risk on the table right now. The overhang from trade policy has been a persistent drag on risk assets throughout Q1, and a significant escalation that impacts global supply chains would send Treasury yields higher and risk assets lower. Bitcoin now behaves like a risk asset in the short term, and an acute macro shock would not spare it.
ETF outflows and a break below $65,600. If institutional holders begin reducing exposure through spot ETFs while price breaks the structural floor at $65,600, the accumulation thesis is dead. A sustained daily close below that level on elevated volume opens the door to $59,000-$60,000 based on measured move targets from the head-and-shoulders pattern visible on the daily chart.
The reason most traders lose money during volatility squeezes is not because they pick the wrong direction. It is because they commit too much capital before the direction is confirmed and then cannot withstand the initial move against them before the real breakout occurs.
Frequently Asked Questions
Does low volatility in Bitcoin always lead to a big move?
Historically, yes. Every major Bollinger Band squeeze and ATR compression in Bitcoin's history has resolved with a move of at least 20% within 30 days of the breakout. The direction is not guaranteed, and roughly 40% of squeezes have broken to the downside, but the magnitude of the subsequent move has been consistently large regardless of direction.
How long can Bitcoin stay in a low-volatility range?
The longest comparable compression was roughly 60 days in the summer of 2023 before BTC broke out in October and rallied 170% over the next five months. The current squeeze at 50-plus days is approaching that historical upper limit, which suggests the breakout window is narrowing to the next few weeks rather than months.
What is the best indicator to confirm a volatility breakout?
No single indicator is sufficient, but the combination of a Bollinger Band close outside the compressed range, a volume spike above the 20-day average, and a flip in funding rates has historically filtered out false breakouts with roughly 73-77% accuracy.
Is Bitcoin's current range bullish or bearish?
The range itself is neutral, but the context leans slightly bullish. BTC has already corrected 47% from its $126,000 ATH, funding rates are negative, and institutional ETF holdings have remained stable through the drawdown. The structural setup resembles the September 2023 accumulation phase more than the July 2025 distribution top.
Bottom Line
Bitcoin's volatility compression to two-year lows is not a signal to relax but a signal to prepare, because every comparable squeeze since 2020 has resolved with a move between 40% and 300%. The current 50-plus day range between $66,000 and $70,000 is approaching the upper limit of historical squeeze durations, which places the breakout window in the next two to four weeks.
A sustained close above $70,200 activates the bullish scenario with an initial target near $76,000 and a trend target above $80,000 if momentum builds, while a close below $65,600 invalidates the accumulation thesis and opens $59,000-$60,000. The catalysts are stacked on both sides, from Fed rate cut expectations and ETF inflows on the bull case to tariff escalation and macro deterioration on the bear case. The one outcome you should not bet on is more of the same quiet, because that is the only trade the data says you will lose.
This article is for informational purposes only and does not constitute financial or investment advice. Cryptocurrency trading involves substantial risk. Always conduct your own research before making trading decisions.