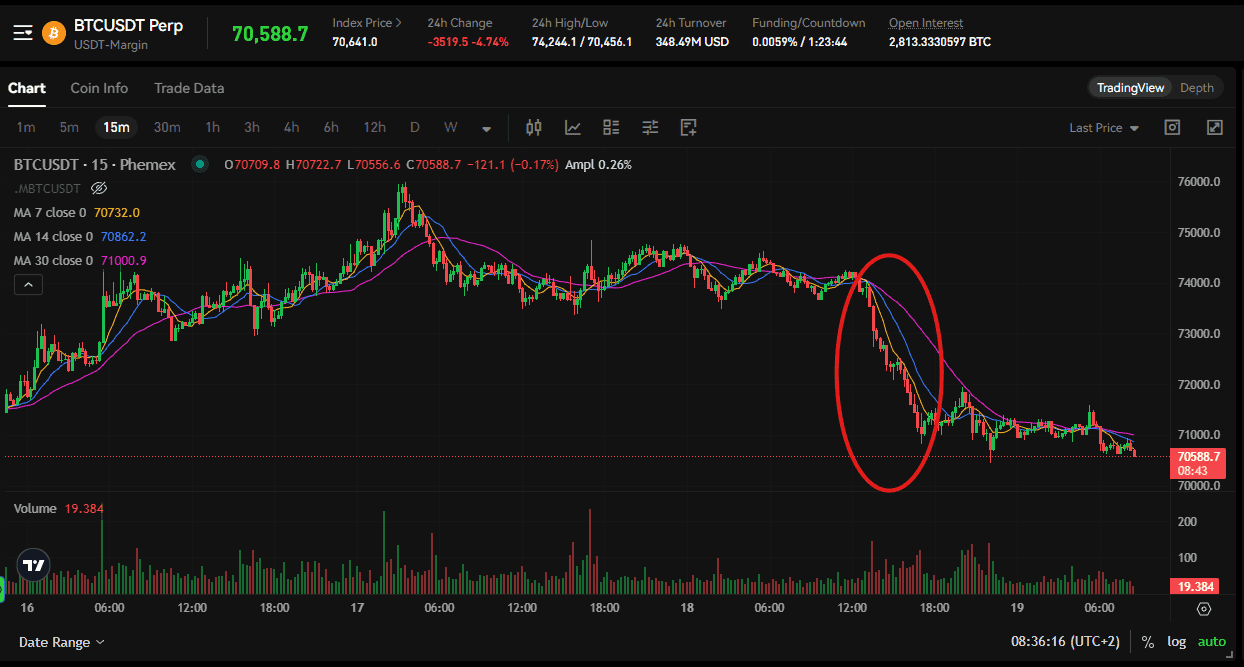
Bitcoin dropped from $74,000 to $70,900 yesterday, March 18, within hours of Powell's press conference. The Fed held rates at 3.50-3.75% exactly as expected, the dot plot stayed at one cut for 2026, and BTC sold off anyway. The Nasdaq closed at its session low, down 1.5%. If this feels familiar, it should. BTC has now dropped after 8 of the last 9 FOMC meetings, and the pattern is so consistent that predicting it has become almost boring.
What's not boring is what happens next. Based on the 2025-2026 data, BTC's post-FOMC low forms approximately 48 hours after the announcement. That places the potential trough in the March 19-20 window, which means today and tomorrow.
What Actually Happened Yesterday
The rate decision itself contained zero surprises. The Fed held at 3.50-3.75% with 99% of the market pricing exactly that outcome. The dot plot median stayed at one 25 bps cut for 2026 and one more in 2027. No change from prior guidance.
The new information came from three places.
The SEP raised the 2026 inflation forecast to 2.7%, up from 2.4% in September. Powell said rising oil prices "for sure showed up" in the committee's updated outlook, confirming that the Iran conflict is now officially part of the Fed's inflation math.
The probability of rates staying unchanged through the July meeting jumped to over 60%, up from 22% last month. That means the market has pushed meaningful rate relief into the second half of 2026 at the earliest.
Seven FOMC participants now expect zero cuts this year, up from the prior reading. The single-cut median dot is the headline number, but the growing hawkish minority tells you the committee's center of gravity is shifting toward higher-for-longer.
Powell pushed back on the "stagflation" label, calling the current setup "some tension between the goals" rather than a 1970s-style crisis. That measured language disappointed bulls who were hoping for dovish signals about eventual rate relief. When the Fed chair says "we won't cut until we see inflation progress," the market hears "higher for longer," and risk assets respond accordingly.
Trade the recovery on Phemex Futures
Why the Sell-the-News Pattern Keeps Working
The mechanics behind this pattern are straightforward, and they explain why it persists even when traders know it's coming.
BTC rallied roughly 8% in the two weeks heading into March 18, climbing from the low $68,000s to $74,000+ on eight consecutive daily gains. That rally was traders positioning ahead of the event, buying in anticipation of the outcome. When the event arrives, the uncertainty premium disappears. The reason to hold the position is gone, and the crowded long side unwinds. Even a neutral outcome (hold, as expected) triggers selling because the anticipation trade is over.
The January 2026 FOMC was the textbook example. The Fed held rates exactly as expected, and BTC still fell from $90,400 to $83,383 within 48 hours, a 7.3% decline. No bad news, no surprise. Just the mechanical unwinding of pre-event positioning.
What made yesterday's selloff slightly different is that BTC entered the meeting with negative funding rates across major exchanges, meaning short positions were already building even as spot price climbed. Historically, negative funding limits downside because there's less leveraged long interest to liquidate. The fact that BTC still dropped 5% despite this defensive positioning tells you the selling pressure came from spot, not futures. That's consistent with ETF-level institutional repositioning rather than a leverage flush, and it's a relevant signal for what happens next.
The 48-Hour Recovery Window
Here's where the pattern gets actionable. Based on 2025-2026 FOMC data, BTC's post-announcement low doesn't form immediately at the close of trading on decision day. It forms approximately 48 hours after the statement, once the second wave of selling (institutional rebalancing, ETF flow adjustments, options expiry hedging) completes.
The January 2026 FOMC held on January 28. BTC bottomed roughly 48 hours later. The same pattern played out across most of the 2025 meetings where BTC declined. The post-FOMC low was a tradeable bottom that held and produced a recovery over the following 1-2 weeks.
If that pattern holds for March, the window is today (March 19) through tomorrow (March 20). The 48-hour clock started when Powell finished speaking at roughly 3:30 PM ET yesterday.
This doesn't mean you should blindly buy at a specific time. It means the historical data suggests that the selling pressure from the FOMC unwind typically exhausts itself within this window, and the subsequent price action has favored buyers who entered during it. The confirmation signal is ETF flow data: if March 19 ETF flows show net inflows (or even flat flows rather than heavy outflows), that's evidence the institutional selloff is contained and the pattern is playing out as expected.
Key Levels to Watch
BTC is trading around $70,500-$71,000 as of this morning. The levels that matter from here are:
$68,000-$68,500 is the post-FOMC bounce zone. If BTC holds above this range and ETF flows stabilize, the historical bottom pattern is confirmed and the recovery phase can begin. This is the level where spot buyers stepped in during the February correction.
$65,600 is the head-and-shoulders neckline that has defined the broader range since early March. A break below this level would invalidate the recovery thesis and activate a measured move target of roughly $59,500. This is the "something has changed" level.
$74,000-$76,000 is the resistance BTC needs to reclaim to confirm the recovery has legs and isn't simply a dead cat bounce. This was the pre-FOMC high and the ceiling that capped every rally attempt for the past several weeks.
Why This Setup Has a Structural Bullish Case
Beyond the mechanical 48-hour pattern, there are three reasons the post-FOMC dip may find a floor faster than previous cycles.
The joint SEC/CFTC ruling from March 17, one day before the FOMC meeting, classified 16 major tokens (including BTC, ETH, SOL, XRP, ADA, LINK, and AVAX) as digital commodities rather than securities in a binding 68-page interpretive release. That's the most significant U.S. crypto regulatory action in years, and it got completely overshadowed by the FOMC selloff and the Iran escalation headlines. Regulatory clarity of this magnitude usually takes weeks to fully price in, and the market hasn't had time to process it while macro noise dominated.
The dissent count is building inside the Fed. Seven members now project zero cuts in 2026, but on the other side, multiple members (including Waller and Miran) have argued for immediate cuts. This internal tension suggests the committee is closer to pivoting than the headline "one cut" median implies. Each meeting that passes without a cut builds pressure for the eventual pivot, and the market will front-run that pivot well before it arrives.
BTC entered this FOMC having already corrected 44% from its $126,000 ATH. The May 2025 FOMC was the one meeting in the 7-of-8 pattern where BTC did NOT sell off. That exception occurred after BTC had already declined roughly 24% from ATH in the weeks prior. March 2026 is structurally similar: the market entered the meeting already beaten down, with negative funding rates and a Fear and Greed index at 26. The setup is closer to the May 2025 exception than to the pre-FOMC euphoria that produced the worst selloffs.
FAQ
Why does Bitcoin drop after FOMC even when the decision is expected?
It's not a reaction to the decision itself. It's the unwinding of the anticipation trade. Traders buy in the days and weeks before the meeting, positioning for the outcome, and when the event passes, the reason to hold disappears. The crowded side of the trade unwinds mechanically, regardless of what the Fed actually says. This has happened after 8 of 9 meetings now, including ones where the Fed cut rates.
Should I buy the dip right now?
The historical data favors buyers who enter during the 48-hour post-FOMC window (today and tomorrow), but only if the $68,000-$68,500 support holds and ETF flows don't show sustained heavy outflows. If you're considering an entry, small position sizes with defined risk (stop below $65,600) align better with the pattern than going all-in at a single price.
What would break the pattern?
A sustained break below $65,600 with heavy ETF outflows on March 19-20 would signal that this isn't a normal sell-the-news dip but a broader risk-off move. The other pattern-breaker would be further Iran escalation or an unexpected macro shock that introduces new selling pressure beyond the normal FOMC unwind.
Bottom Line
The sell-the-news pattern just confirmed for the 8th time in 9 FOMC meetings. BTC dropped 5% from $74K to $70,900 despite the outcome being exactly what 99% of the market expected. The historical recovery data points to the 48-hour post-announcement window (March 19-20) as the zone where selling pressure typically exhausts and a tradeable bottom forms.
The confirmation signals are straightforward: hold above $68,000-$68,500, stable or positive ETF flows on March 19, and no further macro escalation. If those conditions are met, the pattern says the recovery begins here. If $65,600 breaks, the pattern is invalid and the next support level is $59,500.
Disclaimer: This article is for informational purposes only and does not constitute financial advice. Cryptocurrency investments carry significant risk. Always conduct your own research before making investment decisions.