
The digital asset market has entered a period of heightened volatility and significant capital rotation. As of March 5, 2026, the total cryptocurrency market capitalization has reached $2.46 trillion, with a 24-hour trading volume of $154.44 billion.
Bitcoin (BTC), the industry’s primary asset, is currently testing the $72,763 level—a +7.2% increase within a single day.
While the price action appears bullish, underlying sentiment data and institutional flow metrics provide a more nuanced picture. At Phemex Pulse, we analyze the divergence between price performance and market psychology to help you navigate this complex environment.
1. Market Context: The "Perfect Storm" of Narratives and Capital
The current rally is being driven by a combination of macroeconomic stabilization, institutional capital entry, and speculative regulatory rumors.
Institutional Support: $285M in ETF Net Inflows
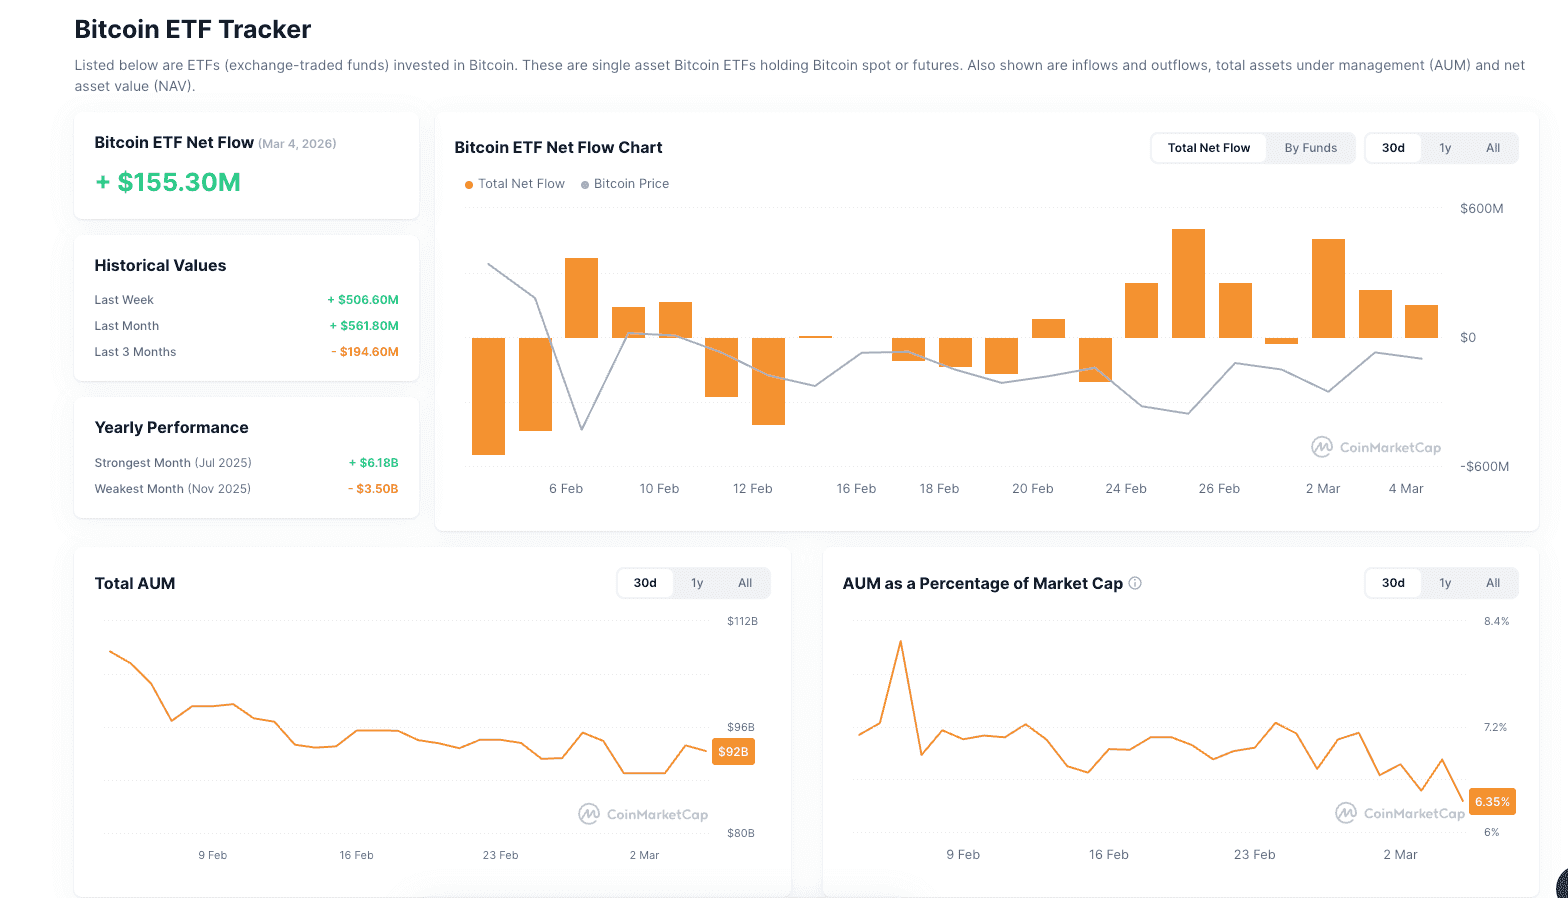
Empirical data from the Bitcoin ETF Tracker confirms that institutional interest is a primary driver of the current market floor. On March 4, 2026, the market saw a total crypto ETF net inflow of +$285.4 Million, with $155.30 Million specifically allocated to Bitcoin Spot ETFs.
Currently, Bitcoin ETF Assets Under Management (AUM) stand at $92 Billion, representing 6.35% of Bitcoin’s total market cap. This steady institutional accumulation suggests that professional allocators are positioning themselves for long-term exposure, despite short-term retail fluctuations.
Policy Speculation: The "Clarity Act" Rumors
The fundamental narrative fuel is the unverified report of the US "Clarity Act of 2026." Policy observers suggest this framework could be the most comprehensive in US history, potentially providing the "Institutional Green Light" for banks and pension funds to hold digital assets on their balance sheets.
Compliance Note: These rumors remain unconfirmed by official government sources. Investors should remain cautious, as "buy the rumor, sell the news" events are common when legislative milestones are delayed or fail to meet market expectations.
Market Mechanics: The $110 Million Short Squeeze
While ETFs provided the floor, technical liquidations provided the vertical momentum. As BTC breached the $71,000 resistance, over $110 million in leveraged short positions were liquidated on Phemex and other major exchanges. This forced buying pressure accelerated the move toward the intraday high of $74,000.
2. The Sentiment Paradox: Fear vs. FOMO
One of the most striking observations from the latest CoinMarketCap data is the divergence between price and psychology.
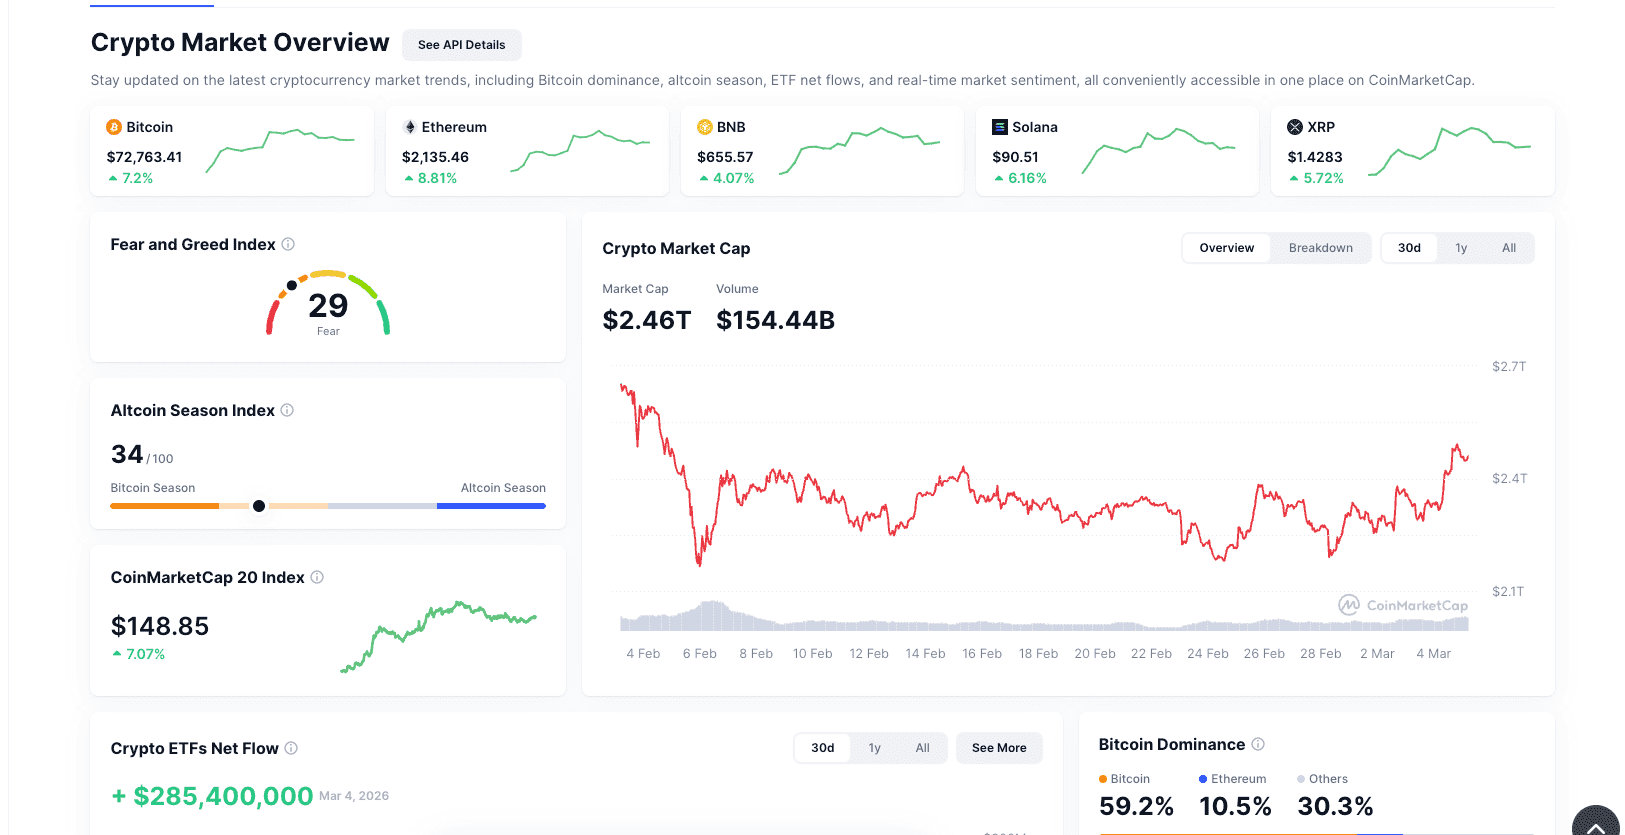
Fear and Greed Index at 29 (Fear): Despite the 7% price surge, the index remains in the "Fear" zone. This suggests that the broader retail market is still recovering from the previous week's geopolitical uncertainty and remains skeptical of the current rally.
Bitcoin Dominance (59.2%): Bitcoin continues to command the lion's share of the market. With the Altcoin Season Index at 34, we remain firmly in "Bitcoin Season." While Ethereum (ETH) has surged +8.81% to $2,135, the market’s capital is primarily gravitating toward the safety and liquidity of BTC.
3. Technical Analysis: Key Levels on Phemex
To understand "Bitcoin Price Today," traders must look beyond the headline number and focus on market structure.
The Resistance Zone: $73,950
The BTC/USDT Daily Chart on Phemex shows the asset testing the very top of its monthly consolidation range.
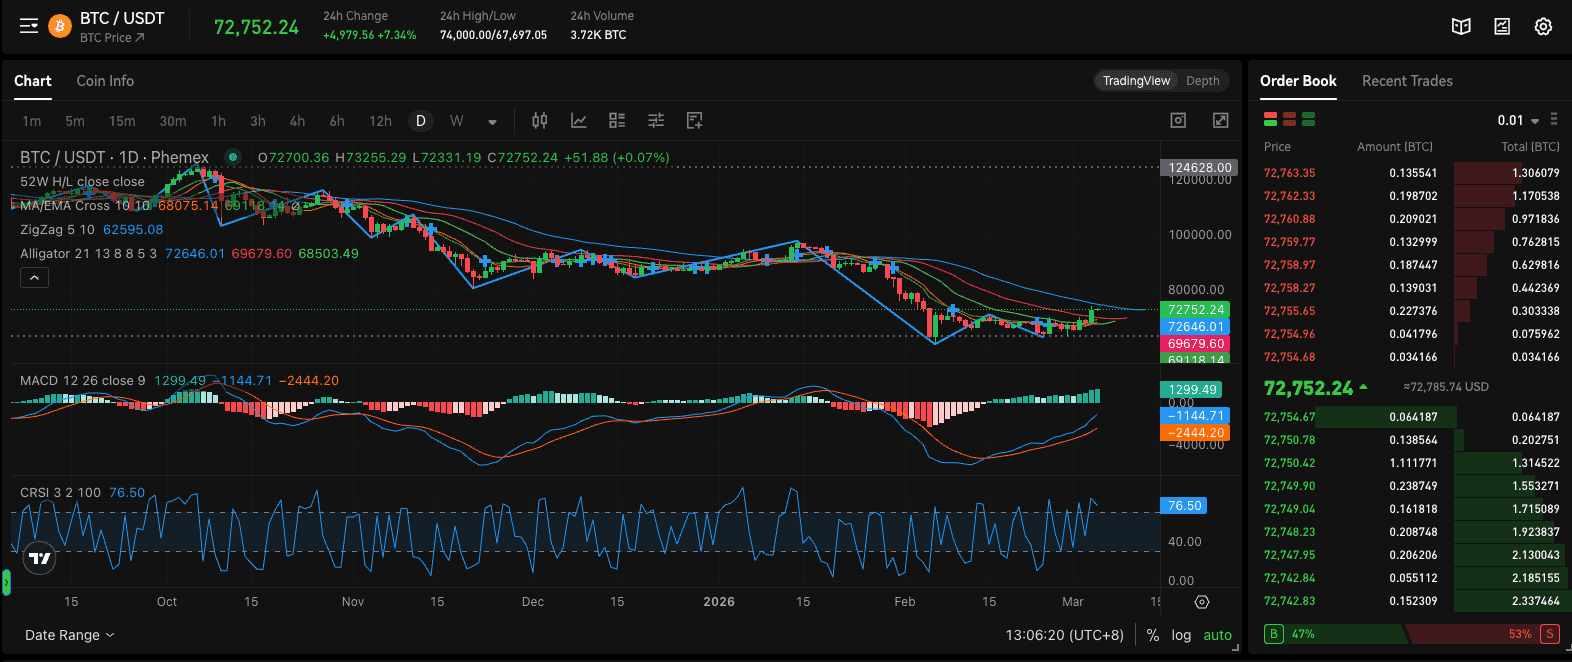
MACD & CRSI: The MACD has completed a bullish crossover, but the CRSI (76.50) indicates the asset is approaching overbought territory.
The "Line in the Sand": A sustained 4-hour candle close above $73,950 would be required to invalidate the bearish structure of the past few weeks. Failure to hold this level may result in a retracement toward the Alligator indicator’s mean support at $68,500.
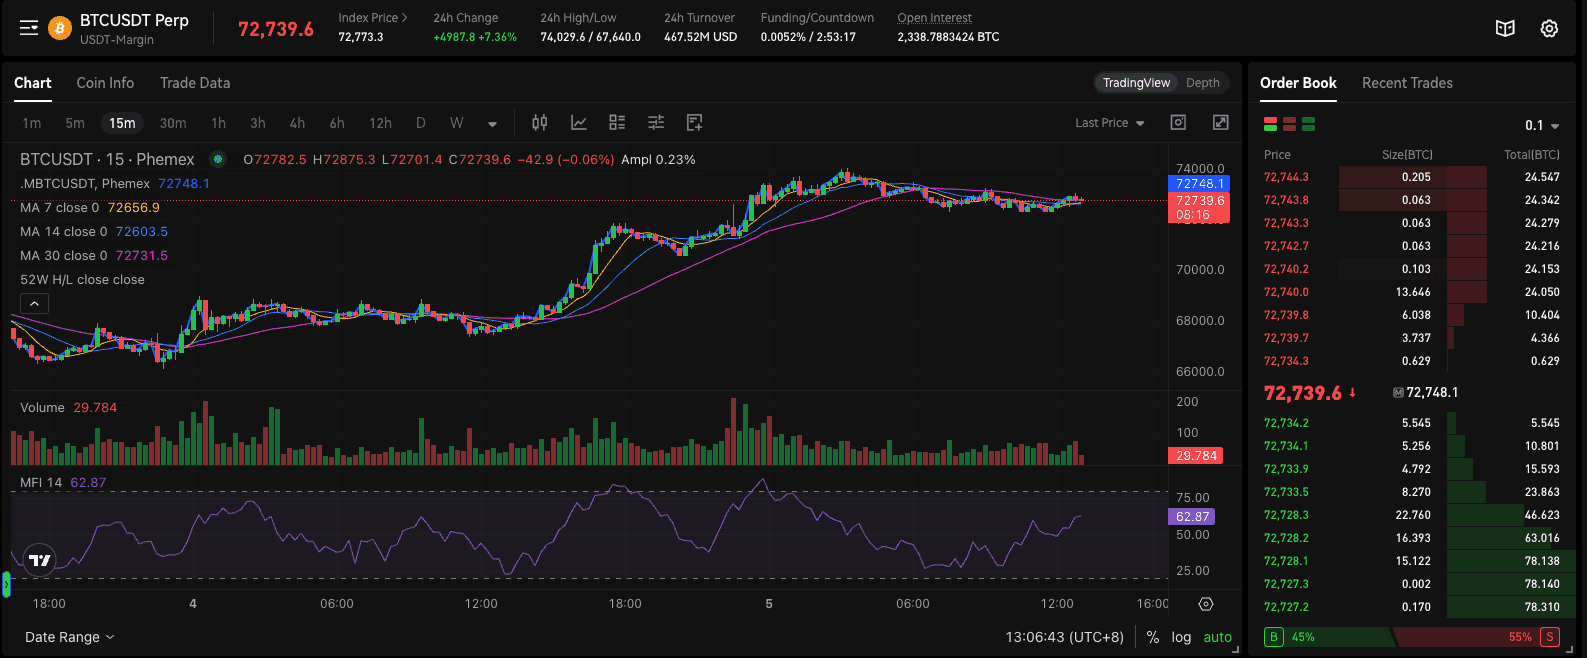
Derivatives Data: Funding & Leverage
On Phemex’s BTCUSDT Perpetual chart, funding rates remain neutral-to-low (0.0052%). This is a critical "de-risking" indicator. It suggests that the rally is not currently being driven by over-leveraged long positions, which often lead to "long squeezes." Instead, the move appears to be supported by a mix of spot buying and the closing of underwater short positions.
4. Strategic Outlook: Trading the Volatility
Based on current data, here is how different market participants are approaching the next 48 hours.
The Conservative Approach (Spot & Yield)
Given that the Fear & Greed index is at 29, conservative investors may view the current "Fear" as a potential accumulation window before sentiment turns "Greedy."
BTC Vault: Rather than trading the "wicks," users can park BTC in the Phemex Vault to earn competitive yields while waiting for regulatory clarity.
The Aggressive Approach (Futures & Margin)
For traders looking to capitalize on the $10,000 swing range:
- Breakout Play: Watch for a consolidation above $73,500 with increasing volume. A move toward the $78,000 liquidity cluster is a common target for trend followers.
- Hedge Play: Given the unverified nature of the Clarity Act, some traders are using Phemex Margin (5x) to hedge their spot positions against a potential “news failure” correction.
- Trade BTC/USDT Futures on Phemex
5. The Bigger Picture: March 2026 and Beyond
The current market cap of $2.46 trillion and Bitcoin dominance of 59.2% highlight the asset’s continued leadership within the digital asset market. Institutional demand remains strong, with over $100 billion in ETF AUM alone.
Institutional FOMO
If the "Clarity Act" rumors materialize, the 6.35% ETF-to-Market-Cap ratio could expand significantly. When sovereign wealth funds or major insurance companies receive a clear legal mandate to allocate even 1% to BTC, the current $73,000 price point may be viewed as a historical consolidation level.
6. Risk Warning and Summary
While the reclaim of $73,000 is a milestone, it is not a guarantee of a straight line to $100,000. The market remains sensitive to:
Macro Stability: Any resurgence in geopolitical tension could trigger a "flight to safety" back into the US Dollar.
ETF Flow Reversals: While Mar 4 saw +$285M in inflows, any significant outflows could weaken the price floor.
Regulatory Reality: If the "Clarity Act" is debunked or significantly delayed, expect a sharp correction in speculative positions.
Actionable Summary:
Monitor: $74,000 resistance and $71,000 support.
Sentiment Check: Watch if the Fear & Greed Index moves from "Fear" to "Neutral"—this often precedes a secondary leg up.
Strategy: Utilize stop-losses and avoid over-leveraging in a rumor-driven environment.
At Phemex, we provide the tools and real-time data to help you navigate these turbulent waters. Whether you are scalping the $73k squeeze or holding for the long-term regulatory breakthrough, trade smart and stay informed.
Disclaimer: This article is for informational purposes only and does not constitute financial, investment, or legal advice. The "Clarity Act" rumors mentioned are currently unverified by official government sources. Cryptocurrency trading involves significant risk of loss. Always conduct your own research and consult with a professional advisor. Phemex is not responsible for any trading losses.