
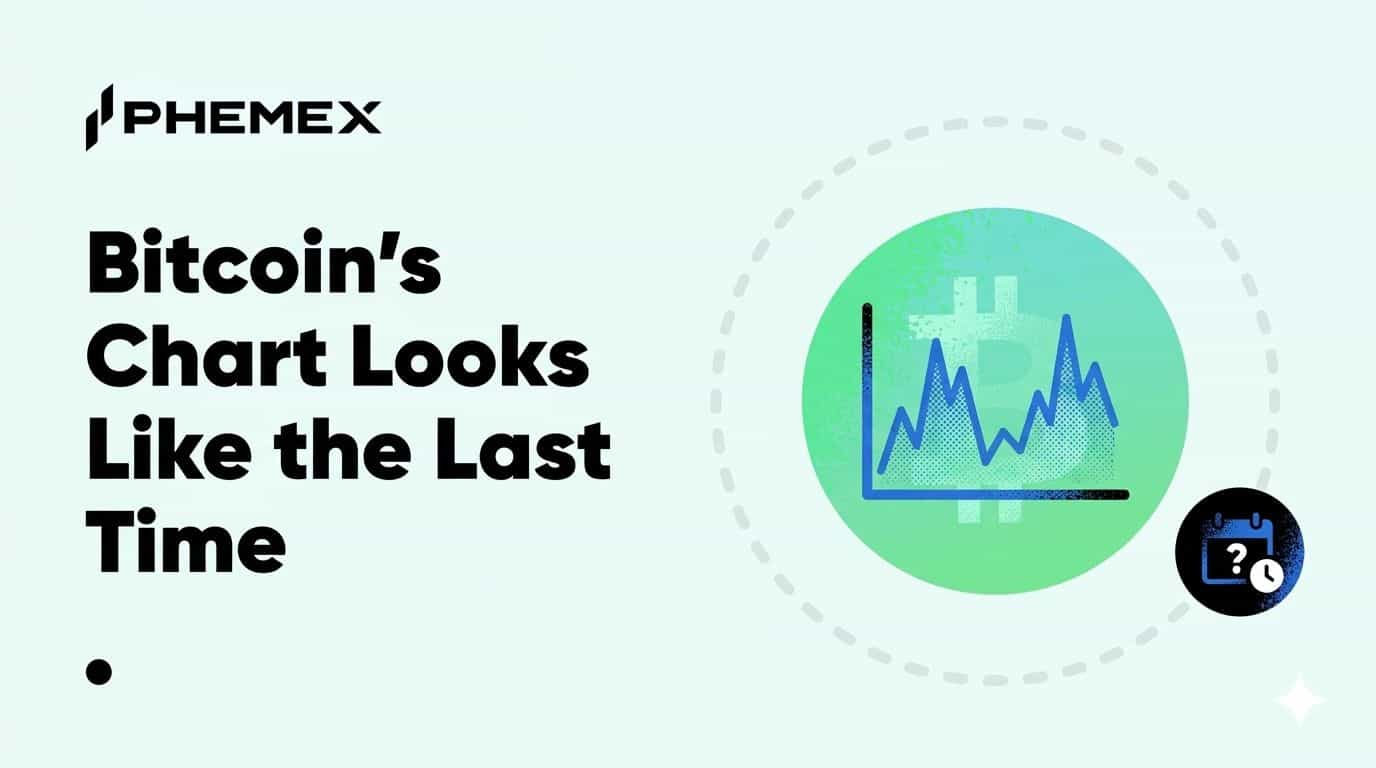
Bitcoin is trading around $68,000, and the chart pattern forming on the three-day timeframe has traders pulling up overlays from the November-to-January selloff that dragged BTC from $90,000 down to $60,000. The resemblance is hard to ignore. A bear flag with roughly 39% of the flagpole already retraced, a descending trendline pressing price lower, and a Fear and Greed Index stuck between 10 and 19.
But pattern similarity does not equal pattern destiny. The market sitting beneath this chart looks fundamentally different from the one that existed six months ago, and those differences will decide what happens next if $65,800 breaks.
The Bear Flag Everyone Is Watching
CoinDesk flagged the pattern on March 20, and crypto Twitter ran with it almost immediately. On the three-day chart, Bitcoin's price action since mid-February traces out a classic bear flag: a sharp drop followed by a slow, low-volume drift upward inside a narrowing channel. The flagpole measures roughly the same percentage as the November selloff, and BTC has retraced about 39% of that move so far.
Source: CoinDesk
If the flag resolves to the downside, the measured target lands right around $60,000, which would match the previous cycle low almost exactly. That kind of symmetry grabs attention, and it should. But textbook patterns complete at textbook rates only about 60-65% of the time, and the setups that get the most social media attention tend to perform worse because crowded trades invite counter-moves.
What the On-Chain Data Says About $60,000-$70,000
Here is where the current setup starts to diverge from the last one. Approximately 400,000 BTC have been accumulated in the $60,000 to $70,000 range according to on-chain clustering data. Think of that as a thick shelf of buyers who picked up coins at these prices and have not moved them since. In November, that shelf did not exist. Price fell through $70,000 with relatively thin support because most of the accumulation had happened much higher.
That 400,000 BTC wall does not make $60,000 a guaranteed floor. It does mean that any move into that zone will run into real supply absorption. Sellers would need to overcome billions of dollars worth of conviction from holders who are already sitting at breakeven or a small loss, and those holders tend to add rather than panic.
The Trendline at $65,800 Is the Real Line in the Sand
Forget the round number at $60,000 for a moment. The more actionable level is $65,800, where a multi-month ascending trendline connecting the September and January lows currently sits. A clean daily close below that trendline would confirm the bear flag and likely trigger a cascade of stop losses clustered just underneath.
Above $65,800, the bear flag remains unconfirmed and BTC retains the option of breaking upward out of the channel. That would invalidate the pattern entirely and put $74,000 to $76,000 back on the table as the next resistance zone. The two outcomes are almost binary at this point, which is why position sizing matters more than directional conviction right now.
Fear and Greed at 10-19: What History Tells Us
The Fear and Greed Index reading between 10 and 19 is the lowest sustained level since the FTX collapse in November 2022. Before that, you have to go back to May 2022 (the Terra Luna crash, when the index hit 8) and March 2020 (the COVID crash, when it touched 10). Every single one of those extreme fear readings preceded a significant rally within three to six months.
That does not mean price cannot go lower first. The index hit 6 during the FTX fallout, and BTC still dropped another 15% before bottoming. Extreme fear is a necessary condition for a bottom, not a sufficient one. But if you zoom out to a 12-month timeframe, buying when this index is below 15 has historically produced outsized returns. The challenge is tolerating the volatility between the buy and the payoff.
What Is Actually Different This Time
Three structural factors separate March 2026 from the November-January crash.
First, institutional flows have shifted. Bitcoin ETFs pulled in $986 million in the first two weeks of March alone, with a single-day inflow hitting $1.7 billion. During the November selloff, ETF flows were net negative for three consecutive weeks. Smart money is buying this dip, not running from it.
Second, the macro backdrop has changed. The November drop happened against a backdrop of rising rate expectations and a strong dollar. Today, rate cut expectations are priced in for Q2-Q3 2026, and the dollar index has softened. That is a tailwind for risk assets, not a headwind.
Third, leverage has been flushed. The November crash wiped out over $2 billion in leveraged longs. The current open interest on BTC futures is significantly leaner, which means there is less fuel for a liquidation cascade. Crashes need leverage to feed on, and the market is running lighter than it was six months ago.
How Traders Are Positioning
The split is clear. Short-term traders are playing the bear flag with tight stops above the upper channel boundary, targeting $62,000 to $60,000. Swing traders and accumulation-minded investors are scaling into positions between $65,000 and $68,000, using the $65,800 trendline as their invalidation level.
The options market tells a similar story. Put volume at the $60,000 strike for April expiry is elevated, but so is call volume at $80,000 for June. The market is pricing in a big move in either direction, which is consistent with the tight range and declining volatility bands you see on the chart. Compressed volatility tends to resolve explosively, and the positioning suggests neither bulls nor bears have full control.
The Bottom Line
The chart pattern is real and it deserves respect, but the supply wall at $60,000-$70,000, institutional ETF inflows, and leaner leverage profiles all suggest that a clean repeat of the November crash is the less likely outcome. Watch $65,800 on the daily close. If that level holds through March, the bear flag will age out and buyers will have the upper hand heading into Q2. If it breaks, $60,000 becomes a genuine test, and the 400,000 BTC accumulated in that zone will either prove to be an immovable floor or the biggest bag-holding event of the cycle.
Frequently Asked Questions
Is Bitcoin going to crash to $60,000?
The bear flag on the three-day chart points to $60,000 as a measured target, but pattern completion rates hover around 60-65%. On-chain data shows 400,000 BTC accumulated in the $60,000-$70,000 range, creating substantial support that did not exist during the last drop. The honest answer is that $60,000 is possible but far from guaranteed.
What does a Fear and Greed Index of 10 mean for Bitcoin?
A reading of 10 means the market is in extreme fear, with most retail participants expecting further downside. Historically, readings below 15 have preceded significant rallies within three to six months. That said, the index can stay at extreme levels for weeks, and price can still drop further before a reversal materializes. It is a signal of opportunity, not a timing tool.
Should I buy Bitcoin at $68,000 or wait for $60,000?
That depends entirely on your time horizon and risk tolerance. Dollar-cost averaging between $65,000 and $68,000 with a stop below $65,800 is one approach. Waiting for $60,000 risks missing a reversal if the bear flag fails to complete. Splitting your position across both scenarios is how many experienced traders handle binary setups like this one.
What happens if Bitcoin holds above $65,800?
If BTC closes above $65,800 on the daily chart through late March, the bear flag pattern ages out and bulls regain the short-term narrative. The next resistance targets would be $74,000 and then $76,000, with the potential for a stronger move if ETF inflows continue at their current pace.
The Bottom Line
The pattern on the chart is worth watching, but the buyers underneath it are worth watching more. Markets repeat their shapes far more often than they repeat their outcomes, and the structural differences between now and November are significant enough to bet on a different ending this time around.
This article is for informational purposes only and does not constitute financial or investment advice. Cryptocurrency trading involves substantial risk. Always conduct your own research before making trading decisions.