









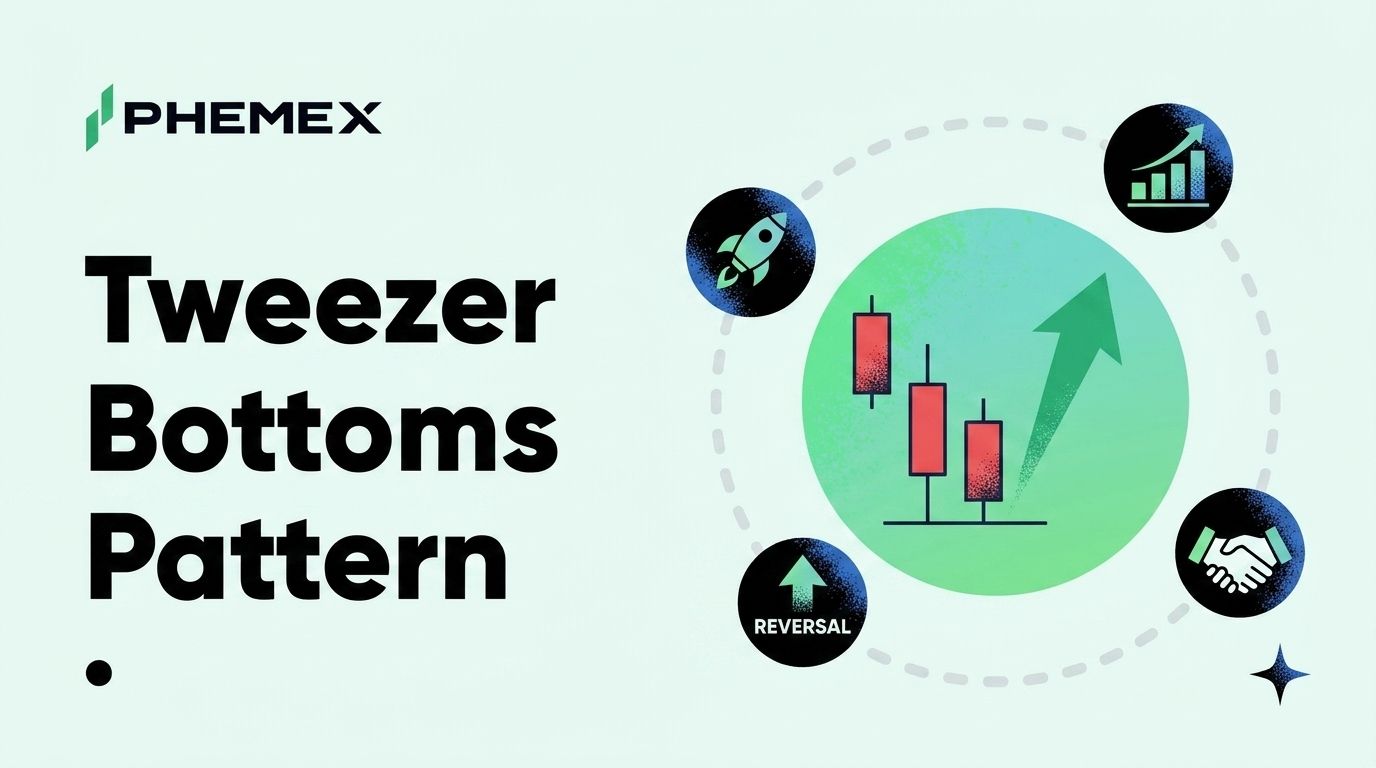
The tweezer bottoms pattern is a two-candle reversal signal that prints at the end of a downtrend when two consecutive sessions test the same low and fail to break it. It looks simple on a chart, two candles with matching wicks on the bottom, but it carries information that most retail traders ignore. The pattern tells you that sellers tried twice to push price lower at the same level and could not. That exhaustion at a specific price zone is one of the cleanest signals that the immediate selling pressure has been absorbed.
This guide covers what the pattern actually is, how to confirm it with volume and RSI, where it fits in the broader reversal-candle taxonomy, and how to trade it on BTC and altcoin charts. The pattern is one of the highest-frequency setups across daily and 4-hour timeframes, and the discipline to wait for confirmation is what separates a profitable execution from a stopped-out one.
What a Tweezer Bottom Actually Looks Like
A tweezer bottom forms when two consecutive candles print lows that are within a tight tolerance of each other, usually within 0.1% to 0.3% on the daily timeframe. The body color of the candles does not matter for the pattern itself, though most strong tweezer bottoms have the first candle bearish and the second candle bullish, which signals the actual reversal in real-time.
Source: gettogetherfinance
The visual signature is the two matching wicks pointing down. Think of the pattern as price hitting a floor twice in a row, with the second test producing a stronger close than the first. The matching lows are what makes it a tweezer rather than a simple double-test that drifts.
Three rules separate a valid tweezer bottom from a coincidence on the chart.
Consecutive sessions matter. The two candles must close on back-to-back trading sessions to qualify as a tweezer. A tweezer bottom is not the same as a long-distance double bottom over several weeks, because the compressed timing is what makes it a tweezer in the first place.
Tight lows define the pattern. The two lows must sit within a tight tolerance of each other for the signal to mean anything. A difference of 1% or more between the two lows is not a tweezer pattern, it is just a normal range expansion. The tolerance is typically 0.3% or tighter on liquid pairs like BTC and ETH.
Downtrend context is required. The pattern must form at the end of a measurable downtrend to be a valid tweezer bottoms signal. A tweezer at the top of an uptrend is not a tweezer bottom, it is a continuation pause or a different setup entirely.
For broader context on how this fits into the candlestick pattern taxonomy, the Phemex academy guide on reversal candle patterns walks through the family of two-candle and three-candle reversal setups that tweezer bottoms sit inside.
How to Confirm the Pattern
The pattern itself is the signal, but the confirmation is what makes it tradeable. Three confirmation checks separate a real tweezer bottom from a noise pattern.
Volume on the second candle. A valid tweezer bottom shows higher volume on the second candle than the first, particularly into the close. The increased volume tells you that the failed test of the matched low triggered actual buyer aggression rather than just a passive bid that absorbed sellers. Without elevated volume on the second candle, the pattern is structurally weaker.
RSI in oversold territory. The 14-period RSI should be below 35 at the time the pattern forms, and ideally below 30. The oversold reading confirms that the broader momentum context supports the reversal interpretation. A tweezer bottom that prints with RSI at 50 is not a reversal signal, it is just a pause in a range.
Close above the high of the pair. The cleanest confirmation is a third candle that closes above the high of the two tweezer candles. This is the actual entry trigger for most disciplined traders. Entering on the second candle alone is faster but carries more risk. Waiting for the confirmation candle reduces the false-signal rate but trades off some of the upside.
|
Confirmation Check
|
Why It Matters
|
|
Higher volume on candle 2
|
Validates buyer aggression
|
|
RSI below 30-35
|
Confirms oversold momentum context
|
|
Third candle close above pair high
|
Triggers entry with structural confirmation
|
Tweezer Bottoms vs Tweezer Tops
The mirror image of the tweezer bottoms is the tweezer tops pattern, which prints at the end of an uptrend with two consecutive candles matching wicks on the upside. The signal is reversal to the downside, with the same confirmation logic applied in mirror. Higher volume on candle two, RSI above 65-70, and a third candle close below the pair's low.
The reason both patterns work is that they signal the same underlying mechanic. Two consecutive failed tests at a price level mean the dominant side has spent its energy trying to push through and could not. When that level is support (tweezer bottoms) or resistance (tweezer tops), the exhaustion logic is identical. The patterns are part of the broader Phemex academy guide on understanding candlestick patterns.
A Real BTC Example
BTC printed a textbook tweezer bottom off the $74,200 zone earlier this week, with the May 25 and May 26 daily candles both closing with low wicks within $35 of each other. The May 26 candle showed roughly 18% higher volume than the May 25 session, with RSI at 31 on both days. The third-candle confirmation arrived on May 27 with a close at $76,840, well above the $75,910 high of the pair.
The trade setup that read this pattern correctly would have entered on the May 27 close with a stop just below $74,100 and a near-term target at the prior swing high near $77,500. The risk-to-reward ratio was approximately 1 to 2.4, which is consistent with the typical setup quality on a confirmed tweezer bottom at a major support zone.
Note what happened next. BTC reached $77,000 on May 28 but failed to clear the $77,500 resistance, then pulled back into the current $74,879 area. The tweezer bottoms signal worked for a multi-day swing but did not produce a sustained reversal because the broader ETF outflow streak overrode the local technical setup. That is the standard caveat with any pattern. Local patterns produce local trades, and macro flow data can override them at any time.
How to Trade the Pattern
The mechanics of trading a tweezer bottom are straightforward once the confirmation rules are clear.
Entry. On the close of the third candle that confirms above the pair high. This is the disciplined entry point. Aggressive traders can enter on the second candle close itself, but the false-signal rate roughly doubles compared to waiting for confirmation.
Stop. Placed below the lowest wick of the two matched candles, typically with a small buffer of 0.2% to 0.5% to avoid getting wicked out on noise. The stop placement is the structural definition of the pattern. If price closes below the matched lows, the pattern is invalidated by definition.
Target. The first profit-take target is usually the prior swing high or the next resistance level above. A more aggressive target uses the measured-move projection, calculating the distance from the pattern low to the nearest resistance and projecting an equal distance above the resistance for a continuation target.
Position size. Risk per trade should be calibrated against the stop distance, not against the position size in dollar terms. A tight stop on a high-conviction setup justifies a larger position than a wide stop on the same chart pattern. The standard discipline is to risk no more than 0.5% to 1% of trading capital per setup.
When the Pattern Fails
Tweezer bottoms fail roughly 30% to 40% of the time across the major crypto pairs, which is typical for any single-pattern signal. The failure modes that produce those losses are predictable and worth understanding.
Macro flow override. A pattern can confirm on the chart while a larger macro driver (Fed announcement, ETF outflow streak, geopolitical event) overrides the local technical setup. This is the most common failure mode on BTC and ETH.
Insufficient volume confirmation. A tweezer bottom with flat volume on candle two is a structurally weaker signal that fails more often. The volume check exists precisely to filter these out.
Wrong timeframe. Tweezer bottoms work best on the daily and 4-hour timeframes. On the 5-minute or 15-minute timeframes, the noise level is high enough that the pattern signal is weak. On the weekly timeframe, the pattern is rare but very powerful when it prints.
The discipline of accepting that 30% to 40% of clean setups will fail is part of trading any pattern. The job is to size correctly so that the wins outweigh the losses across a sufficient sample.
Frequently Asked Questions
Does a tweezer bottoms pattern work on every cryptocurrency?
It works on any liquid pair where candle patterns reflect real price discovery rather than thin-order-book noise. BTC, ETH, SOL, and the top 20 by market cap produce reliable tweezer signals. Low-liquidity pairs print noisier patterns that fail more often.
What is the best timeframe for tweezer bottoms?
Daily and 4-hour charts produce the highest-quality signals for the pattern. The weekly chart is rare but powerful, and the 1-hour can work for short-term trades. Anything below 1-hour tends to produce too much noise for the pattern to be reliable.
Can I use tweezer bottoms with other indicators?
Yes, and combining the pattern with RSI, volume profile, and key support levels improves the win rate meaningfully. The long-wick candle setup is a related pattern that pairs well with tweezer signals at major support. The pattern alone has a 60% to 70% success rate with proper confirmation, but stacking it with other technical inputs at major support zones can push the rate higher.
Is the third-candle confirmation always necessary?
It is the disciplined version of the trade setup. Aggressive traders enter on the second candle close to capture more of the move, but the false-signal rate is meaningfully higher. The tradeoff is faster entry against lower win rate.
Bottom Line
The tweezer bottoms pattern is one of the cleanest two-candle reversal setups in the candlestick toolkit because the matched-low signature is unambiguous. The trade discipline that separates profitable execution from gambling is the confirmation stack. Volume on the second candle, RSI in oversold territory, and a third candle close above the pair high.
For BTC right now, the May 25-26 tweezer bottom at $74,200 was a textbook setup that produced a multi-day swing but did not become a sustained reversal because the broader ETF flow picture overrode the local technical. The takeaway is the same one that applies to every pattern. Local patterns produce local trades. Macro context determines if those local trades become bigger structural moves.
This article is for educational purposes only and does not constitute financial or investment advice. Cryptocurrency trading involves substantial risk. Always conduct your own research before making trading decisions.
