

Summary
- Aroon is designed to reveal when new trends begin and is especially useful in signaling when ranging markets are about to trend.
- The movement of the two lines that comprise the indicator, the Aroon Up and Aroon Down lines, are produced using the number of periods since the last 25-period high or low.
Momentum trading is no uncommon practice in finance and is one of the most effective trading strategies developed to date. Instead of buying low and selling high, momentum traders look for high volumes during strong trends to shave a profit from the flurry.
Momentum traders use various indicators to track momentum and detect trends, and while they all aren’t entirely accurate all the time, some indicators are more popular than others.
In general, momentum indicators give traders a better understanding of the rate of an asset’s price changes, and they are best used in conjunction with other tools and indicators. They often don’t work to identify price direction and instead provide insight into the timeframe in which the price change could take place. Since momentum indicators don’t predict direction, they are generally paired with other indicators like the directional movement index to create positions based on the trend’s strength.
What is The Aroon Indicator?
In 1995, the Indian money management expert Tushar Chande created the Aroon indicator to gauge a market’s momentum. This was not his first stint in creating indicators. Chande had created many other indicators before, such as the intraday momentum index, the Chande momentum oscillator, the variable index dynamic average, and more.
Signals from momentum indicators are much more accurate during strong trends, and they don’t work too well in ranging markets or markets where the price rapidly shuttles between extremes.
Named after the word for the dawn’s first light in Sanskrit, Aroon is designed to reveal when new trends begin and is especially useful in signaling when ranging markets are about to trend.

source: Investopedia
What is Aroon Up Down Indicator?
Unlike other momentum indicators, which measure price fluctuations by comparing historical prices, Aroon tracks price relative to time. The movement of the two lines that comprise the indicator, the Aroon Up and Aroon Down lines, are produced using the number of periods since the last 25-period high or low.
For example, on a daily chart, the Aroon Up line would graph the number of days since the last 25-day high, and the Aroon Down line would show the days since the previous 25-day low. Denoted on a percentage scale of 0 – 100, the Aroon Up and Down lines indicate a bullish or bearish trend, respectively, and when either is closer to 100, the corresponding trend is said to be stronger.
It’s important to note here that the ‘high’ and ‘low’ referenced aren’t relative to the asset’s entire price history, but only to the highest and lower prices over the pre-determined period, usually 25 periods. The latest output from Aroon ignores all prices before this point.
Technical analysis is a critical part of trading cryptocurrencies, and with the number of indicators out there, it can be hard to know which ones are useful. Within momentum indicators itself, there are so many alternatives that traders are spoiled for options. Chande himself somewhat specialized in creating measures of market momentum, but looking at the same thing from different perspectives can have its advantages.
Giving the Market Aroon for its Money
The central underlying assumption Aroon makes is that an asset’s price will regularly close at new highs when a market trends upwards. Similarly, markets should make regular new lows during a downtrend. Since the indicator is scaled between zero and hundred and tracks the last 25-periods, a reading above 50 would mean the price made a new high in the previous 12.5 days. An Aroon Down reading near 100 generally signals a recent new low.
How to Trade With The Aroon Indicator?
When the Aroon Up line is near 100 while the Aroon Down is near zero, the market is generally considered in a strong bullish trend. The converse of this is also true, but the two lines drawing parallel to each other can also signify a ranging consolidation period.
This is also signaled when both the Aroon Up and Aroon Down are under 50 because neither new highs nor lows are being created. Breakouts in these situations are also used to identify what the coming trend could look like.
At times, markets can trend for too long, causing the assets to be overbought or oversold. In these cases, the Aroon lines may stay near the 100 level for extended periods. However, sudden drops to the 90 level don’t always signify a trend reversal. In fact, as long as the Aroon Up stays above the Aroon down, a drop to 90 could represent a temporary corrective move and show that the market will recover.
In the absence of either bullish or bearish trends, traders can observe both of the Aroon lines above 70 or below 30. During this period, the asset’s price may either consolidate or present a protracted reversal of an older trend. However, If the two lines intersect above 50, there is potential for a trend reversal.
To make things easier, as a part of the Aroon Indicator system, Chande created the Aroon oscillator. This oscillator gauges the strength of the Aroon indicator’s trend using a single graph, with readings above zero indicating an uptrend and readings in the negative signaling downtrends. Here, crossovers above and below the zero-line can often represent trend changes, and big moves from, say, -50 to 50 can signal a more substantial shift.
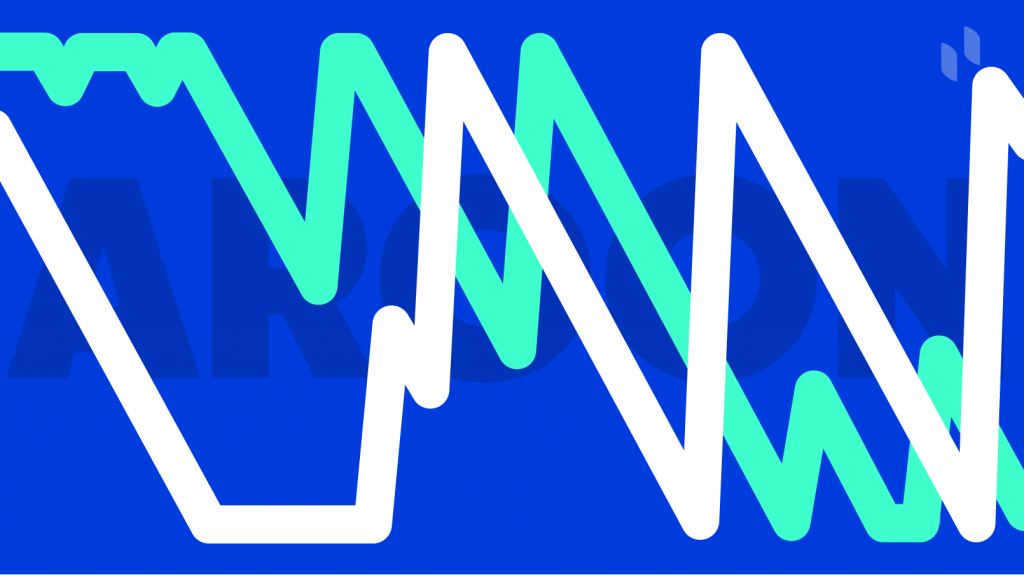
The Aroon indicator is most useful in detecting changes in trends. As a triangular wave function, crossovers between the two Aroon lines are easily noticed, creating clearly identifiable buy and sell signals. Traditional oscillators used sine waves to provide visual representations, but these can be harder to see and measure, especially on shorter time-scales.
A buy signal occurs when the Aroon Up line crosses above the Aroon Down and vice versa for the sell signal. Since the indicator is good at finding out whether a market is trending or consolidating, it also gives traders a better idea of what trading style could make the best use of the situation.
However, being a lagging indicator based on historical price, there will always be some lag between the position of the lines and the trend it presents. It’s important to remember that Aroon is more influenced by time than by price movements, with the indicator moving based on how long ago the high or low was and not how large the change is.
Aroon vs. DMI
This is similar to Welles Wilder’s Directional Movement Index (DMI), which uses up and down lines to show trend direction. However, unlike the Aroon indicator, DMI measures the price difference between current and historical highs and lows, giving more weight to price instead of time. Many other similar indicators give more importance to the price difference, such as the ROC (Rate of Change), which looks at how far the current price has moved relative to the price in the past.
Risk Management When using The Aroon Indicator
Despite its reasonable degree of accuracy, Aroon should never alone be used to base an investment. Indicators aren’t always accurate, and using other indicators to confirm a trend can bring more perspective to your decisions. When used to analyze charts for long-term investments, the Aroon indicator should only complement fundamental analysis and not drive its deductions.
It can be tempting to follow a crossover blindly, but it doesn’t always indicate a significant price movement. Even on relatively flat price charts, crossovers often occur as the price will eventually touch a new high or low within 25 periods. It’s crucial for traders to factor in price analysis and other forms of review using information from multiple indicators.
Using Aroon solo can produce some very poor signals, and this can be especially true in choppy or ranging markets. The cryptocurrency space is infamous for its volatility, so it’s important to keep this in mind when investing in blockchain-based tokens. The Aroon indicator is susceptible to failure during large price spikes, and traders should have an exit strategy in mind for these kinds of situations.
Trading Crypto with The Aroon Indicator
Since cryptocurrency markets are more volatile than traditional stock markets, the standard 25-period length of time is often replaced with 14. Of course, this is down to personal preference, and investors can customize Aroon’s parameters to their individual likings. More extended periods identify trend peaks better, while traders can use shorter periods to prepare for potential scalps.
In general, a shorter period allows the indicator to move around more because less data is involved, reducing the range of possible values. It could also be worth retaining the 25-period span to be ‘in sync’ with the market.
Aroon is very similar to the moving average indicator in that it focuses mostly on time since the most recent high or low. Both are used by traders executing a trend-following strategy, but how a trader uses Aroon should be centered around the trading timeframe. Too few periods can generate too much noise to be useful for short-term investments.
Conclusion
The Aroon indicator has been around for decades, and its widespread use is a testament to its utility. Like any lagging indicator, Aroon is not predictive in nature, but this isn’t too important on longer time scales. Knowing how strong the ongoing trend gives analysts the ability to predict price increases in the long-term and can even help prevent traders from taking action when it’s uncertain how an asset will perform.
While the Aroon indicator relies more heavily on time rather than price, many crypto traders value it for this very characteristic. Time can be just as important as price in forecasting, and the Aroon indicator can help traders use strategies to exploit them both.
Aroon was developed to anticipate shifts in price action from ranging to trending to establish long or short positions, but it can also indicate when an asset’s price is likely to start consolidating from a trend. This can help prevent needlessly subjecting your assets to market volatility, which is especially valuable in markets as unpredictable as cryptocurrencies.
Read More
- How to Read Crypto Charts: Learn Trading Chart Patterns
- What Is Momentum Trading? Profiting from Market Volatility
- What Is Trend Trading: Following the Market When It Pays
- Uptrends and Downtrends: How to Spot and Trade Them?
- SMA Trading Strategies for Crypto Trading
- Swing Trading Crypto: What are the Best Indicators for Swing Trading?
- How to use Leading, Lagging, and Coincident Indicators?
- Stochastic Oscillator: Everything You Need To Know