









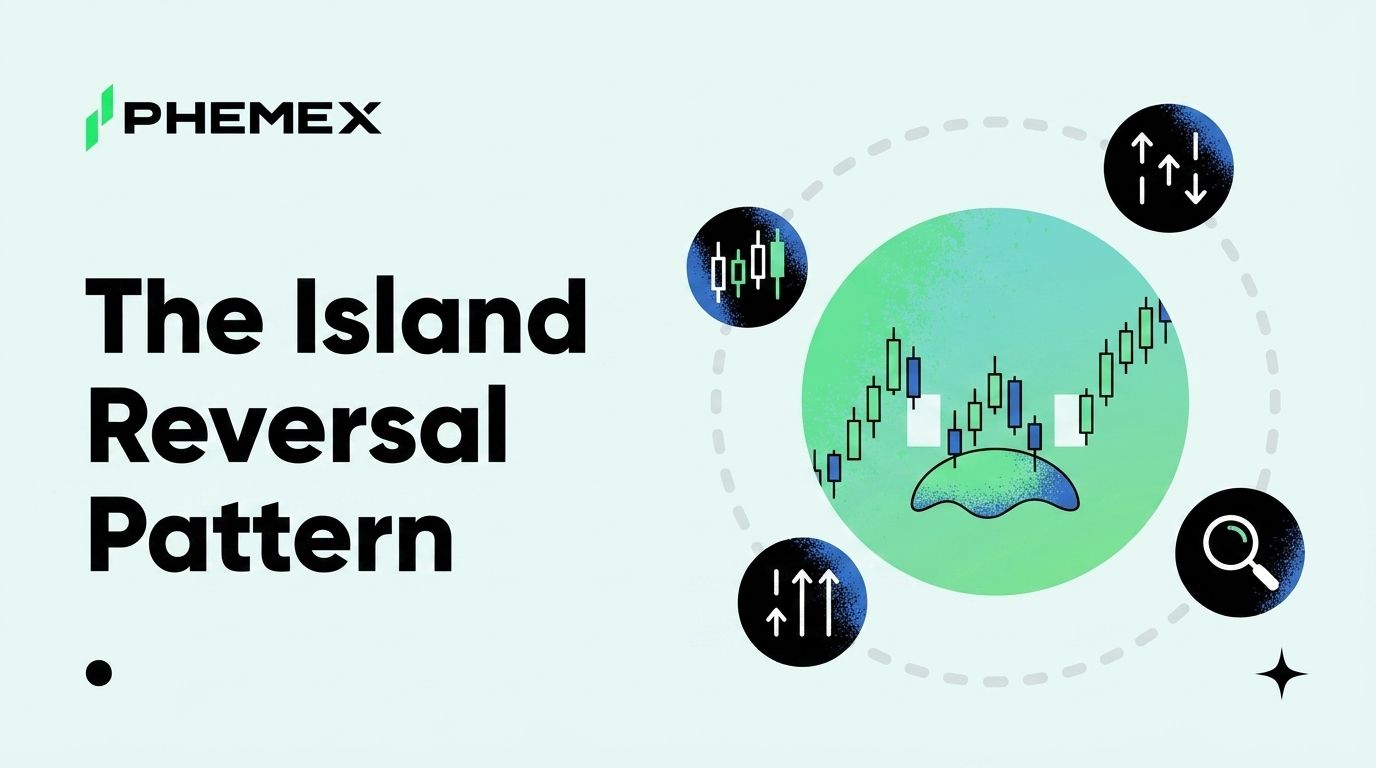
An island reversal is a chart pattern in which price gaps in the direction of the trend, stalls in a cluster of candles, then gaps back the other way, leaving that cluster isolated from the rest of the chart like an island in open water. The two gaps frame the same price zone, and the entire definition rests on one condition. Neither gap gets filled. When that condition holds, the pattern marks one of the most abrupt trend changes in technical analysis, because the market effectively refuses to trade at the island's prices ever again.
The rules are strict, and the crypto version of this pattern lives in places most traders never think to look.
The Anatomy of an Island Reversal
The pattern is built from three parts, and the first is a gap in the direction of the prevailing trend. After an extended move, price jumps clean over a zone and leaves an exhaustion gap, the type of gap that forms when the last wave of participants chases the trend at any price. Gap mechanics are a study of their own, and our guide to crypto gap trading breaks down how each gap type behaves after it forms.
The second part is the island itself. Price stalls beyond the gap and trades sideways in a cluster that can be a single candle or several weeks of them. Momentum flattens, the trend stops making progress, and the cluster starts to look detached from everything that came before it.
The third part is a breakaway gap in the opposite direction, cutting back through roughly the same price zone the first gap skipped. That second gap is what strands the cluster. Price action now sits above or below empty space on both sides, and the market has jumped over the same territory twice in opposite directions.
And that leads to the rule the entire pattern hangs on. The two gaps must remain open for as long as the position is held. A gap fill, where price later trades back through either empty zone, deletes the island and the signal along with it. This is not a soft guideline the way volume confirmation is. An island reversal with a filled gap is not a weaker island reversal. It is no pattern at all.
Island Top vs Island Bottom
The pattern comes in two mirror-image forms, and the table below separates them feature by feature.
|
Feature
|
Island top
|
Island bottom
|
|
Prior trend
|
Established uptrend
|
Established downtrend
|
|
First gap
|
Gap up as late buyers chase
|
Gap down as holders capitulate
|
|
The island
|
Candles stall at the highs and stop advancing
|
Candles base at the lows as selling dries up
|
|
Second gap
|
Gap down through the same zone
|
Gap up through the same zone
|
|
Signal
|
Bearish reversal
|
Bullish reversal
|
|
Who gets trapped
|
Longs who bought inside the island
|
Shorts who pressed inside the island
|
The trapped-trader row explains why the follow-through is often violent. Everyone who opened a position inside an island top is underwater the moment the second gap prints, and their exits fuel the new downtrend. The same mechanism runs in reverse under an island bottom, where trapped shorts cover into a market that has already gapped away from them.
An island high frequently forms at or near an earlier swing peak, which turns the larger structure into a variant of the double top pattern with a gap-built second peak. When those two patterns overlap, the reversal case is stronger than either pattern alone.
What Volume Should Look Like Inside the Island
Volume is the difference between an island that means something and a random cluster of candles beyond a gap. The exhaustion gap should print on heavy, climactic volume, because that gap represents the final burst of one-sided demand or supply. Inside the island, volume typically stays elevated while price goes nowhere, which is the signature of distribution at a top or accumulation at a bottom. Big players are handing inventory to latecomers, and the flat price hides a busy transfer.
The breakaway gap should then arrive on another volume expansion. That spike tells you the reversal has real participation behind it rather than a thin overnight drift.
When the sequence prints on quiet, unremarkable volume, treat the island as suspect. A sleepy island is usually a pause, and pauses resolve in the direction of the original trend more often than against it. Individual candles inside the cluster carry information too, and reversal candles such as dojis and hammers appearing near the island's edge often foreshadow the second gap before it opens.
Why Islands Are Rare on Crypto Spot Charts and Where They Actually Print
Here is the problem for crypto traders. A gap requires a market to close, reopen, and skip the prices in between, and Bitcoin spot never closes. BTC and the major pairs trade 24/7 with deep books, so one candle's close is the next candle's open and true gaps almost never exist. A pattern defined by two gaps is close to structurally impossible on a BTC spot chart.
The pattern is alive in two crypto-adjacent places. The first is the CME Bitcoin futures chart, where the traditional Friday close and Sunday reopen produce weekend gaps whenever spot moves while the futures market is dark. Those weekend gaps are the raw material islands are made of, and an island on the CME chart is a legitimate two-gap pattern even though the underlying asset trades continuously elsewhere. Traders who only watch spot never see these formations, which is exactly why they are worth checking after a volatile weekend.
The second place is thin altcoin books. Trading halts, relistings after a suspension, brand-new listings, and moments when liquidity simply vanishes from a small-cap pair can all print genuine skipped price zones. An altcoin that reopens far from its last traded price after a halt behaves like a gapping stock, and a reversal built around two such events carries real information about who was trapped.
Treat the source of the gap as part of your analysis. A gap born from a scheduled market close or a halt reflects a genuine repricing. A gap on a pair that trades $40,000 a day reflects an empty order book and nothing else.
How to Trade the Second Gap
Entry comes from the breakaway gap, never from anticipation. Wait for the candle that opens the second gap to close, confirming the gap survived a full session rather than filling intraday. Aggressive traders enter on that close. Patient traders wait for a retest, where price drifts back toward the gap's near edge, probes it, and fails to trade through. A shallow probe that holds is one of the better entries in gap trading, because your invalidation sits inches away. A full fill during the retest simply tells you there was no pattern, and it tells you before the loss grows.
The stop belongs inside the island. Place it beyond the gap's near edge, inside the cluster, so that a normal retest does not touch it but any real reoccupation of the island does. If price is trading comfortably back inside the island, the market has re-accepted those prices and the reversal thesis is already dead, so there is no reason to let the stop sit beyond the island's far extreme.
Targets follow the measured move logic used across candlestick and chart patterns. Take the height of the island from its top to its bottom and project that distance from the breakaway gap's edge in the direction of the new trend for the first objective. The secondary objective is the origin of the exhaustion leg, meaning the level where the final pre-island thrust began, since trends that end in exhaustion tend to retrace the ground that thrust covered. Scale out rather than exiting all at once, because reversals that start with a trapped crowd often run past the first measured objective.
When the Pattern Fails and What a Failure Teaches
The clean failure is a gap fill. Price rotates back through the breakaway gap, reoccupies the island, and eventually closes the original exhaustion gap too. Your stop inside the island handles this scenario mechanically, and the discipline is refusing to argue with it. A reversal pattern that the market un-reverses is finished, and re-entering on hope is how a small planned loss becomes a large unplanned one.
The subtler failure is the fake gap. Illiquid pairs gap constantly on low timeframes because nobody is quoting, and those voids say nothing about sentiment. If the gap would not exist on a chart with a real order book behind it, no island built from it is tradeable.
The last trap is mixing up two opposite playbooks. Regular gap-fill trading bets that a common gap inside a range gets closed, and it is a mean-reversion bet with decent odds precisely because most ordinary gaps do fill. The island trade bets the opposite way on a rarer setup. The way to keep the two straight is context. A gap inside a sideways range with no volume story is a fill candidate, while a gap that follows months of trend, prints climax volume, and pairs with a second gap in the same zone is an island. Betting on a fill against a fresh island, or betting on an island where there is only a routine gap, loses from the first tick.
Frequently Asked Questions
Is an island reversal bullish or bearish?
It can be either, and the direction of the second gap gives the answer. An island top gaps up, stalls, then gaps down and is bearish, while an island bottom gaps down, bases, then gaps up and is bullish. The signal carries more weight on daily and weekly charts than on intraday timeframes, where small gaps appear and fill routinely.
How rare is an island reversal?
Rare even in markets that gap daily, because it needs two opposing gaps through the same price zone with a trend change between them. On 24/7 crypto spot charts it is close to nonexistent, since continuous trading removes the gaps the pattern is made of. CME Bitcoin futures charts and halted or newly listed altcoins are where crypto traders realistically find one.
What invalidates an island reversal?
A filled gap, on either side of the island. Price trading back through the breakaway gap and holding inside the island is the early warning, and a full close of either empty zone ends the pattern outright. Volume that never expanded on the gaps is a softer red flag that the island was a pause rather than a reversal.
What is the success rate of the island reversal in crypto?
The honest answer is that no reliable published success rate exists for crypto markets. Spot venues trade around the clock and rarely gap, so the sample of true crypto islands is far too small for meaningful statistics, and any precise percentage you see quoted is borrowed from equities studies such as those on Investopedia or simply invented. Size positions as if the pattern can fail, because it can.
Bottom Line
If a mature trend prints a gap, a stalled cluster, and an opposing gap through the same zone on expanding volume, treat it as an island and position in the direction of the second gap. If either gap fills at any point, exit without debate, because the market has erased the pattern's one defining condition. If the chart is a 24/7 spot pair, question the gap before you question the pattern, and go look at the CME chart or the halt history to find out what actually skipped. An island stops being an island the moment either gap fills, and so does the trade.
This article is for educational purposes only and does not constitute financial or investment advice. Cryptocurrency trading involves substantial risk. Always conduct your own research before making trading decisions.
