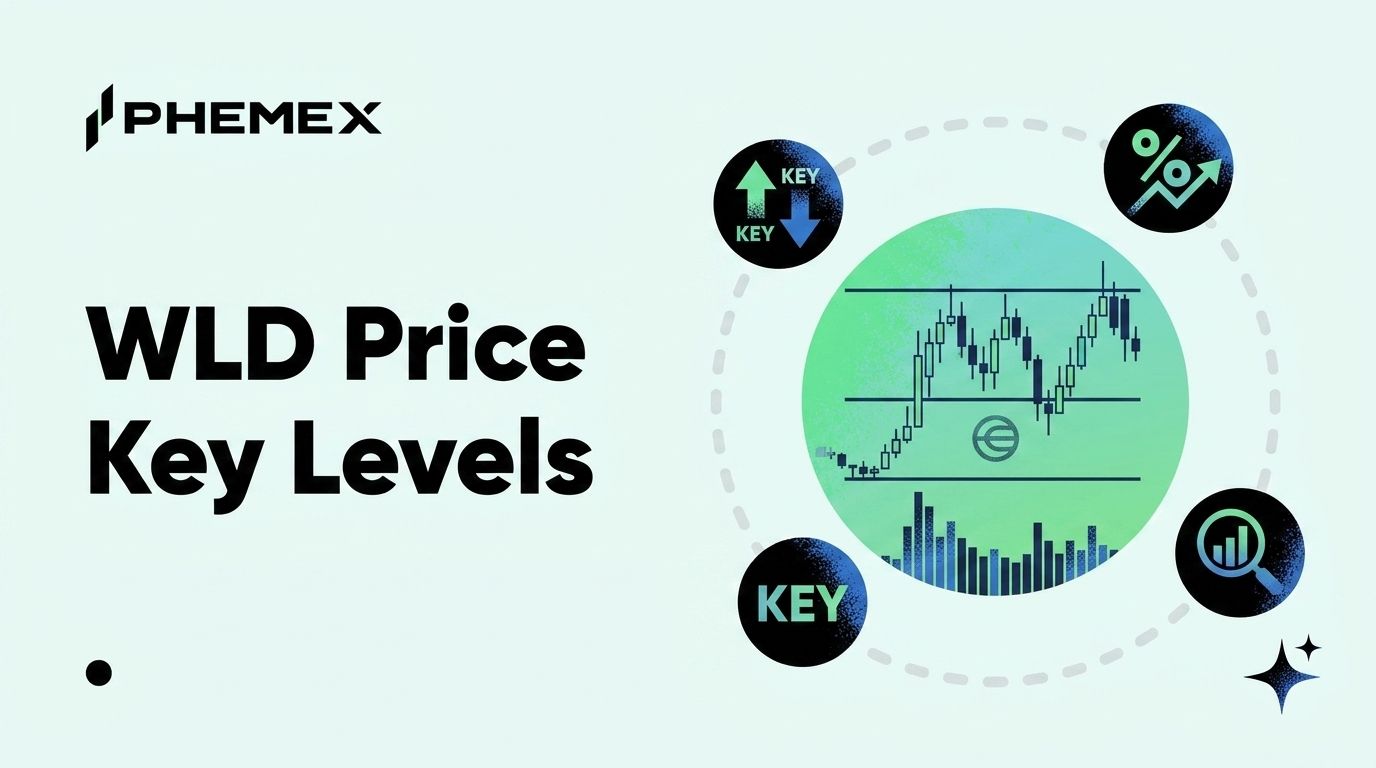
Worldcoin (WLD) is trading near $0.2947 as of May 24, 2026, up roughly 12.39% on the week, with 24-hour spot volume sitting in the $250 million range across major venues. The bounce comes off an all-time low printed near $0.23 on May 18, less than a week before the rally, which means the chart is technically a reversal off capitulation rather than a continuation pattern. The token still sits 97% below its March 2024 high near $11.74, inside a base that has held the same range since the start of the year. The interesting question is not if WLD is cheap, but which side of that base breaks first and what would have to be true for either move to stick.
The Current Setup and What the Seven-Day Move Actually Tells You
WLD spent most of April and the first half of May grinding lower from $0.40 into a fresh all-time low at roughly $0.2303 on May 18. The week since that print has produced a 12.39% recovery into the $0.29 zone, which makes the chart a reflex bounce off a panic low rather than a confirmed trend change. Volume on the up days has been higher than the down days for the first time since February, which is the only constructive thing the tape is currently saying.
The seven-day candle structure shows three notable features. WLD reclaimed the $0.26 prior swing low as new support on the way back up, held a higher low at $0.27 on the May 22 retest, and stalled at $0.2945 to $0.2965 twice in 48 hours without breaking through. The 50-day moving average sits near $0.31, the descending trendline from the early-April $0.46 print sits in the same area, and a cluster of failed bounces from late April capped at $0.30 the last three times price tried. Everything between $0.295 and $0.31 is a battle zone rather than a setup, so the trade is to either wait for confirmation above that band or to scale a starter position inside the existing range with a defined invalidation. You can pull the live chart from TradingView WLD/USDT for tick-by-tick structure, and CoinGecko's Worldcoin pagegives the cleanest cross-venue volume read.
The Support and Resistance Map Every WLD Trader Should Have on Their Chart
WLD has a clean level structure because it has been ranging for so long. The same horizontals have been tested four and five times each, which makes them genuine. Here is the map worth marking.
|
Level
|
Price
|
Why it matters
|
|
Major resistance
|
$0.45 to $0.48
|
Range high since January, capped three rallies, breakdown level from April
|
|
Mid-range resistance
|
$0.36 to $0.38
|
200-day moving average plus prior consolidation shelf
|
|
First resistance
|
$0.30 to $0.31
|
50-day MA, descending trendline, current battle zone
|
|
Current price
|
$0.2947
|
Where the May 24 print is sitting
|
|
First support
|
$0.26 to $0.27
|
Reclaimed last week, May 22 higher low
|
|
Major support
|
$0.23
|
All-time low from May 18, 2026, capitulation print
|
|
Invalidation
|
Below $0.22
|
New ATL, opens air pocket to $0.18
|
Read the map in pairs. Above $0.31 the next obvious target is $0.36, then $0.45. Below $0.26 the next target is $0.23, then air. The dead zone between $0.27 and $0.30 is where most chop happens and where retail accounts die from a hundred small stop-outs. Phemex's support and resistance primer walks through how to draw and confirm these horizontals without redrawing them after every wick. One context point that is not on the price chart at all. The total network value of WLD around $0.30 sits near $300 million in circulating market cap, the lowest valuation Worldcoin has traded at since its July 2023 launch.
The Vesting Overhang Bear Case Bulls Keep Ignoring
Worldcoin's tokenomics include a daily emission of roughly 5.1 million WLD that flows to community grants, team allocations, and Tools for Humanity reserves on a continuous release schedule. At current prices that is approximately $1.5 million of new supply hitting the market every single day, against a 24-hour spot volume of $250 million. Every rally over the past year has been sold into because there is a permanent, mechanical, daily seller on the other side of the book. That is not a thesis, it is an arithmetic problem. You can pull the full schedule from DefiLlama's Worldcoin emissions dashboard and Tokenomist's WLD vesting page, which both show roughly 32% of total supply circulating today with the full vesting running into 2038.
There is a scheduled change to this structure that matters more than any short-term price candle. On July 24, 2026, the daily WLD emission rate drops by 43%, falling from 5.1 million to approximately 2.9 million tokens per day. The mechanism was hard-coded into the contracts in 2024 as part of the extended vesting schedule, and Reuters covered the original lock-up extension when Tools for Humanity announced it. If structural seller intensity halves in eight weeks and demand stays even flat, the supply-demand math turns from grinding selling pressure into something closer to neutral. The bear case is that demand has been falling faster than supply, which is why price made a new ATL into the cut rather than rallying ahead of it.
The Breakout Scenario and the Risk Management That Keeps You in It
A credible bullish setup needs a daily close above $0.31. Not an intraday wick, not a five-minute spike on a Coinbase listing rumor. A daily close above the 50-day MA, the descending trendline, and the prior resistance cluster, ideally on volume at least 1.5 times the 20-day average. The confirmation candle is a successful retest of $0.30 as new support within five trading days. WLD has faked above $0.31 twice already in 2026 only to round-trip back inside the range, so the retest is the filter that separates an actual breakout from another bull trap. Once both conditions are met, the technical target is the $0.36 to $0.38 shelf, with the major resistance at $0.45 to $0.48 as the second target. World ID user-growth catalysts are the fundamental wildcards that could accelerate the move, since any tier-one platform integration, new US city Orb launch, or AI-fraud headline that puts proof-of-personhood in the news cycle has a track record of producing 8% to 15% green candles on WLD. You can track cross-exchange spot moves on CoinMarketCap's Worldcoin profile for the daily percentage read.
The setup invalidates on a daily close below $0.26, which breaks the higher-low structure from May 22 and reopens the path to a $0.23 retest. A break below $0.22 is a new ATL and the trade is wrong. Position sizing math is what keeps you in the trade long enough for either side to play out. With a $0.295 entry and a $0.255 invalidation, the risk per unit is about 14%, so a 1% account risk implies roughly 7% of capital in the position. Phemex's position sizing guide walks through the math, and the risk-reward ratio breakdown covers how to pick targets that justify the risk. A move from $0.295 to $0.36 against a $0.255 stop is a 1.5-to-1 reward profile, while a move to $0.45 is closer to 3.7-to-1, which is where the trade starts to look genuinely attractive. Anyone using high leverage on a token that just printed a fresh ATL one week ago and still faces structural sell pressure for another two months is asking for a liquidation, so 2x to 3x is the practical ceiling.
Frequently Asked Questions
What is the most important WLD price level to watch this week?
$0.31 on the upside and $0.26 on the downside. A daily close above $0.31 with a successful retest opens the path to $0.36, while a daily close below $0.26 breaks the higher-low structure and reopens the $0.23 ATL as the next target. Anything between those levels is range chop where most active trades give back their edge.
Does the July 2026 WLD emission cut matter for the price?
It matters more than any short-term technical level, because the daily emission drops from 5.1 million to 2.9 million tokens and removes roughly $650,000 of daily mechanical selling at current prices. That is the kind of supply-side change that can flip a multi-month grind into a base breakout, but only if demand is flat or rising into the cut.
Is WLD oversold at current prices?
On standard momentum oscillators the answer is yes, with the 14-day RSI hitting 22 on the May 18 ATL print, which is statistically extreme and historically associated with mean-reversion bounces. The harder question is if oversold readings on a chart with active token vesting and a 97% drawdown from ATH are tradeable signals or just noise. Oversold helps with timing the entry, never with deciding if the asset is a good long-term hold.
What invalidates the WLD bullish setup right now?
A daily close below $0.26 invalidates the short-term setup. A daily close below $0.22 invalidates the medium-term thesis entirely and signals a new leg lower with $0.18 as the next obvious horizontal. Macro risk factors that would override the chart include a major new regulatory action against Worldcoin in a tier-one jurisdiction, a security incident involving the Orb network, or any tokenomics change that increases the emission schedule.
Bottom Line
WLD at $0.2947 sits in the middle of the trade, not the start of it. The high-quality entries were $0.23 to $0.25 last week, the high-quality short was the $0.30 rejection in late April, and the next clean signal is binary. Above $0.31 with a confirmed retest, the chart targets $0.36 and then $0.45, and the July 24 emission cut becomes a tailwind rather than an overhang. Below $0.26 on a daily close, the structure breaks and $0.23 comes back into play with $0.22 as the line that ends the bullish thesis for this cycle. Size the position against the $0.255 invalidation, never against the dollar amount you are excited about, and let the July supply cut tell you if the base resolves higher or just gets longer.
This article is for informational purposes only and does not constitute financial or investment advice. Cryptocurrency trading involves substantial risk. Always conduct your own research before making trading decisions.