










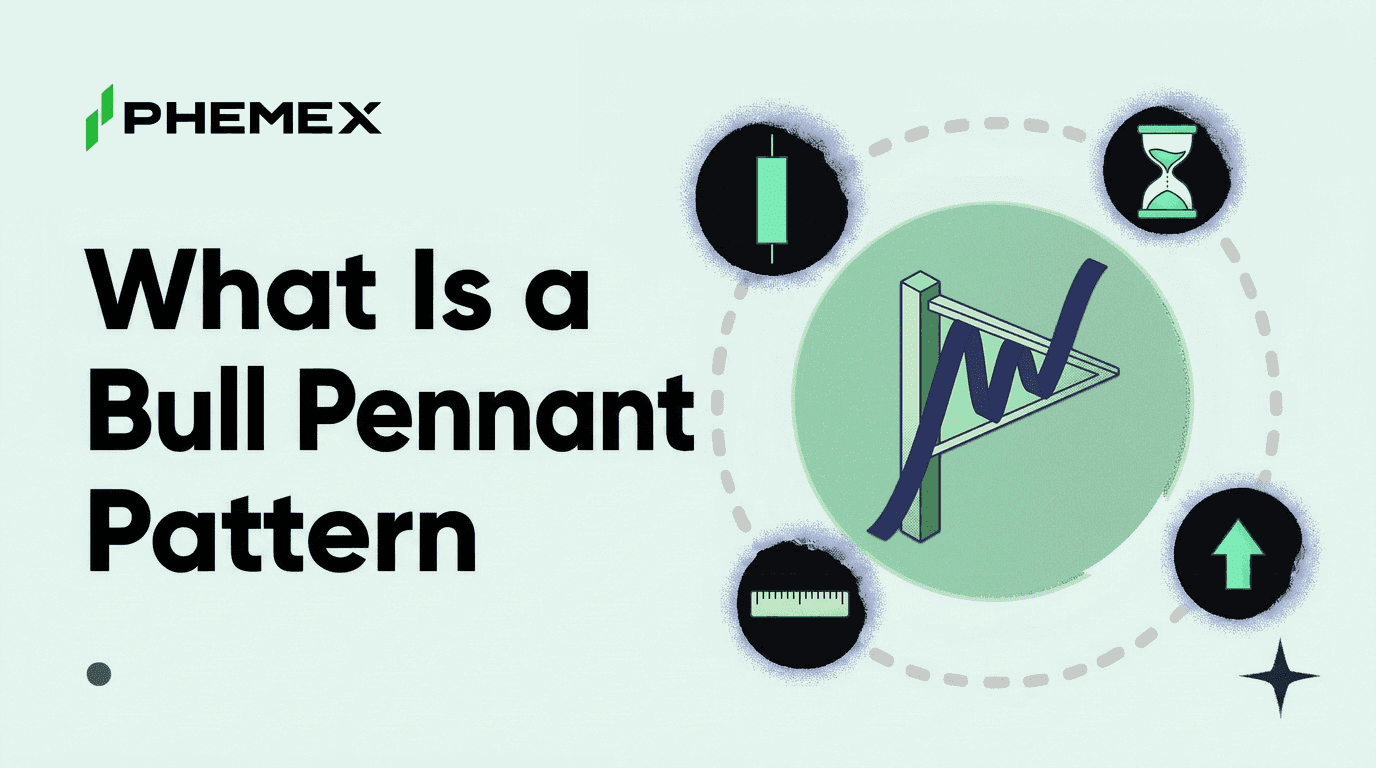
A bull pennant pattern is a small triangle of converging lines that forms after a sharp rise. Traders read a close above its upper line as the rise resuming, so it's often called a bullish pennant. The sharp rise is the flagpole, and textbooks want the pause after it to last no more than three or four weeks.
On the 28 Phemex crypto perpetual futures we tested, sharp rallies were common, but a clean bull pennant after one was rare. From February 2024 to the early-November close, about one rally in 120 paused in a textbook pennant and broke out. Three of the five breakouts stood higher ten days later, against 45% of all days, and five is too few to call an edge.
The Bull Pennant at a Glance
|
Signal
|
What it tells you
|
In the test
|
|
Flagpole
|
A sharp rise
|
About 600 rallies of 15%+
|
|
Pennant
|
A narrowing triangle
|
5 formed, 7 to 13 days
|
|
Breakout
|
A close above the upper line
|
UNI at 6.526, 14 Sep 2026
|
|
Target
|
Pole height added at the break
|
Hit in 10 days by 2 of 5
|
|
Bull record
|
Higher 10 days later
|
3 of 5, all days 45.1%
|
|
Bear pennant
|
The mirror after a fall
|
6 of 10 lower, all days 54.8%
|
What Is a Bull Pennant Pattern?
In ChartSchool's words, "Flags and Pennants are short-term continuation patterns that mark a small consolidation before the previous move resumes". A continuation pattern is a pause that ends with the earlier trend carrying on, so a bull pennant only exists inside an uptrend that has made a sharp move higher.
Picture a coin that jumps hard in a few days. Early buyers take profit and late buyers buy the dips, so each swing comes out smaller than the last.
Draw a line across the falling highs and another across the rising lows, and you get a small triangle pointing right. Traders who like the pattern wait for price to leave that triangle through the top.
Its closest relative is the bull flag pattern, where the pause forms what ChartSchool calls "a small rectangle pattern that slopes against the previous trend". The pennant's lines squeeze together, and that narrowing is what separates the two.
What Does a Bull Pennant Look Like?
A bull pennant looks like a tall pole with a small flag on top, a near-vertical rally followed by a tight triangle that points to the right. It has three parts, and each one has a job.
-
The flagpole is the sharp rise that comes first, and ChartSchool wants heavy volume on it.
-
The pennant is the pause, which ChartSchool calls "a small symmetrical triangle that begins wide and converges as the pattern matures (like a cone)" in its guide.
-
The breakout is the first daily close above the upper line.
Time is part of the shape too. ChartSchool says "Ideally, these patterns will form between one and four weeks," so a pause that drags on for months is something else.
Is a Pennant Bullish or Bearish?
A pennant can be either, and the move before it decides which. For a bullish pennant, ChartSchool says "a break above resistance signals that the previous advance has resumed". In a bearish one, "a break below support signals that the previous decline has resumed".
Tom Bulkowski's stock statistics lean bullish. His pennant figures rest on "more than 1,600 perfect trades" in a bull market, with breakouts going upward 57% of the time. Those are his numbers on stocks, last updated in August 2020.
On the 28 Phemex perpetuals in the test, the bearish version broke out twice as often as the bullish one, 10 times against 5. So the label tells you which way the pole ran, and in this test neither version told you much about what came after the break.
How Rare Is a Bull Pennant in Crypto?
We wrote the rule down before testing it, and changed one line of it once, after a first version found no pennants at all. Then we ran it on the daily bars of 28 Phemex USDT perpetual futures, from February 2024 to the early-November close. Perpetual futures are contracts with no expiry date, and these 28 had traded on Phemex for that whole window.
A rally counted when a close stood at least 15% above the lowest close of the previous ten days and set a fresh ten-day high. A pennant needed one to four weeks of lower highs and higher lows that never gave back half the rally. The signal was the first close above the upper line.
The rally rule fired on 2,269 days. Counted once each, those days made about 600 separate rallies, and only five of them ended in a bull pennant breakout. We chose that way of grouping them after seeing the results. The five came between June 2024 and September 2026.
Bitcoin had five sharp rallies of its own and no pennant. Loosening the rally rule to 10% or tightening it to 20% still found only 6 and 5 pennants, so the rarity didn't hinge on one setting.
|
10 days after the signal
|
Bull pennant breakouts
|
All days, same markets
|
|
Closed higher
|
3 of 5 (60%)
|
12,275 of 27,216 (45.10%)
|
|
Median move
|
+2.86%
|
-1.32%
|
The base rate counts every day on the same markets when a signal could have fired and ten more days followed, and the median is the middle result.
The pennants came out ahead, but one fewer up close would have dropped them to 2 of 5 and behind an ordinary day. These returns are before trading costs and funding, with no leverage.
UNI was the clearest win of the five. It rallied about 65% in nine days, paused for a week and closed above the upper line on 14 Sep 2026. It traded past its target within ten days and closed the tenth day about 40% higher. By mid-October it had given most of that back.
AAVE shows the same shape failing. It rallied about 65% in August 2026, drifted for nearly two weeks and closed above the upper line in early September. Ten days later it was about 12.5% lower and nowhere near its target, though a month after the break it stood well above its breakout close.
How Do You Trade a Bull Pennant?
The textbook trade buys the breakout and aims at a measured target, with volume as the confirmation.
Entry: The signal is the first daily close above the upper line, the point ChartSchool reads as the advance resuming. The five results above are all measured from a buy on that close.
Target: "The flagpole length can be applied to the resistance break or support break of the flag/pennant to estimate the advance or decline," ChartSchool says. You measure the pole from where the rally started to its top and add that height to the breakout close. Two of the five breakouts reached that level within ten days, UNI among them.
Volume: ChartSchool adds that "An expansion of volume on the resistance (support) break lends credence to the validity of the formation". Both breakouts with dollar volume above their prior 20-day average closed higher ten days later, against 1 of the 3 without it. With five cases in all, that split supports no conclusion about volume.
Stop: ChartSchool's pennant guide names no stop-loss level, and the test used none, so the point where you admit the trade is wrong is yours to set.
Futures use leverage, and a leveraged position is closed automatically if losses reach its margin, a forced exit known as liquidation in crypto trading.
Bull Pennant vs Bear Pennant: How Do They Differ?
A bear pennant is the bull pennant flipped upside down. A sharp fall forms the pole, the price pauses in a small converging triangle, and the signal is a close below the lower line.
The mirror rule found ten bear pennants on the same markets, and six of them stood lower ten days after the break. That compares with 54.8% of all days closing lower over the same stretch. Their median ten-day move was a 4.7% drop, against a 1.3% drop for all days.
That last figure matters. Over this window the typical ten-day move on these markets was a small loss, so a bearish call had the market's drift behind it. One fewer down close would have put the bear pennants under the base rate too.
Bull Pennant vs Symmetrical Triangle: What Is the Difference?
Time and the pole tell them apart. ChartSchool says "A pennant more than 12 weeks old would turn into a symmetrical triangle". Bulkowski draws the line much sooner on stocks. His rule reads "Pennants are short, 3 weeks long or less," and he counts anything longer as a symmetrical triangle or a wedge.
The pole is the other half of the test. ChartSchool says flags and pennants "must be preceded by a sharp advance or decline," and without that pole there's no height to project a target from. All five pennants in the test lasted 7 to 13 days, inside both limits.
What Mistakes Do Traders Make With Bull Pennants?
Seeing pennants everywhere: Any pause after a jump can look like a pennant on a busy chart. A pause that runs for months has outgrown both textbooks' time limits and become a symmetrical triangle. Held to a written rule, only a handful of pauses qualified on 28 markets in nearly three years.
Trusting one data feed: The same rule run on another data feed's daily bars for the same 28 coins found 6 bull pennants, and only 3 of them came from the same rallies. A small difference in one day's high or low moves a trend line enough to make or break the shape.
Chasing the first break: A break can reverse within days and catch the buyers who chased it, a move traders call a bull trap. AAVE's September 2026 breakout behaved like one, and over the next ten days it never traded more than a few cents above its breakout close.
Leaning on five trades: Five breakouts can't tell an edge from luck. At the pace the test found them, collecting 50 clean pennants on these markets would take more than 25 years.
How Can You Spot a Bull Pennant on Phemex?
Phemex's futures chart has no pennant tool, so you build one from two trend lines on the TradingView tab.
-
Load the BTC futures chart on Phemex and switch to its TradingView tab.
-
Open the drawing toolbar from the small tab at the chart's left edge.
-
Pick Trend Line (Alt+T) and draw from the top of the pole across the lower highs that follow it.
-
Draw a second Trend Line from the lowest low in the first half of the pause across the higher lows.
-
Set the chart to daily candles and watch for a daily close above the upper line.
Each line is an ordinary trend line of the kind used to mark Bitcoin support and resistance, drawn here through a few days of highs or lows. The Patterns menu also has a Triangle Pattern tool that draws the outline in one go, and like every drawing tool it only shows what you place.
Frequently Asked Questions
Is a pennant a flag?
No, though the two are close cousins. A flag pauses in a small sloping rectangle and a pennant in a small converging triangle. ChartSchool treats both as short continuation patterns that follow a sharp move.
How long does a bull pennant take to form?
ChartSchool's ideal is one to four weeks, and Bulkowski's stock work puts the cap at three. In the Phemex test, the five pennants that broke out took one to two weeks after the pole's top.
How do you measure a bull pennant's target?
Add the flagpole's height to the breakout close. UNI's pole rose about 2.9 before its 6.53 breakout in September 2026, so the target sat near 9.4, a level it passed within ten days.
Bottom Line
On these crypto markets the sharp rally was the everyday event and the tidy pennant after it was the exception. A trader who waited for a clean one across all 28 would have traded five times in under three years. What the pattern gives you is a map, with a line where textbooks say the rally resumes and a pole that sets the target.
That map is the reason to learn the shape.
Disclaimer: This article is for informational purposes only and is not financial advice. Cryptocurrency trading involves substantial risk. Always do your own research before making investment decisions.
